- GBP/USD steps back from a five-week top to 1.3045.
- Bullish MACD, confluence of 200-bar SMA and 38.2% Fibonacci retracement can challenge sellers.
- Buyers will have to defy a three-week-old ascending channel formation to revisit the early September tops.
GBP/USD drops to 1.3045, down 0.12% intraday, as markets in Tokyo open for trading on Tuesday. In doing so, the pair justifies its U-turn from the 50% Fibonacci retracement level of the September month’s downside, which in turn suggests further weakness to come.
However, the 1.3000 round-figure and a joint of 200-bar SMA and 38.2% Fibonacci retracement level near 1.2985 will challenge the bears during the pair’s further weakness.
Also likely to probe the GBP/USD sellers, past-1.2985, will be the support line of an ascending trend line from September 22, at 1.2910 now.
Considering the bullish MACD conditions, the prices may remain the short-term upside bias unless it stays beyond the immediate key support near 1.2985.
Alternatively, an upside clearance of 50% Fibonacci retracement level near 1.3080 will find it difficult to cross the mentioned channel’s upper line, currently around 1.3105, during the additional rise.
Even if the GBP/USD buyers manage to cross 1.3105, a 61.8% Fibonacci retracement level of 1.3175 will stop the extra north-run afterward.
GBP/USD four-hour chart
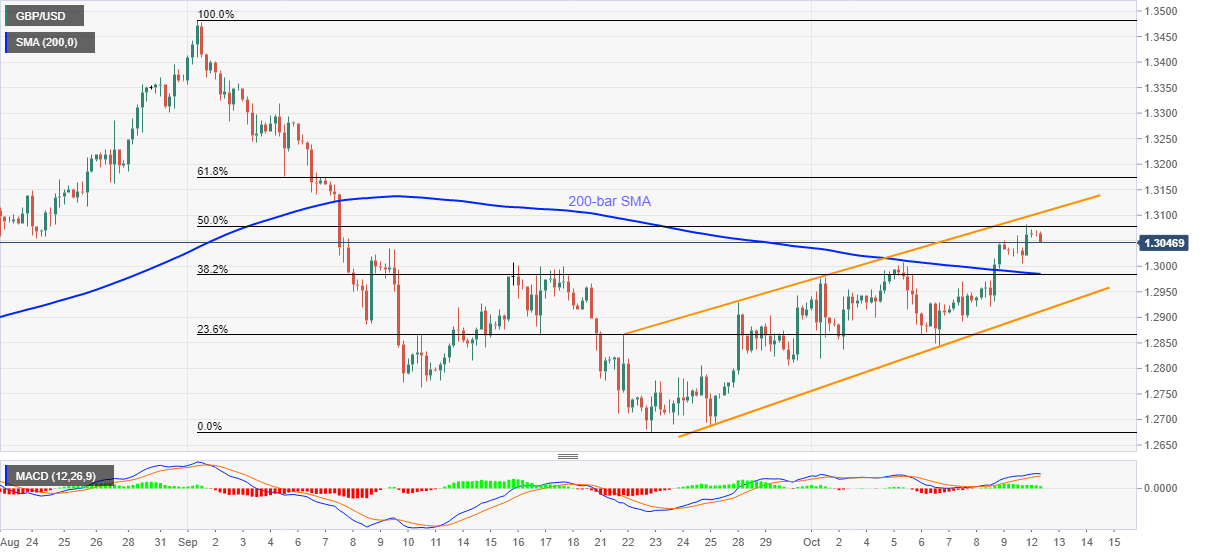
Trend: Pullback expected
