- GBP/USD witnessed some heavy selling on the last trading day of the week.
- Mixed technical indicators on hourly/daily charts warrant caution for traders.
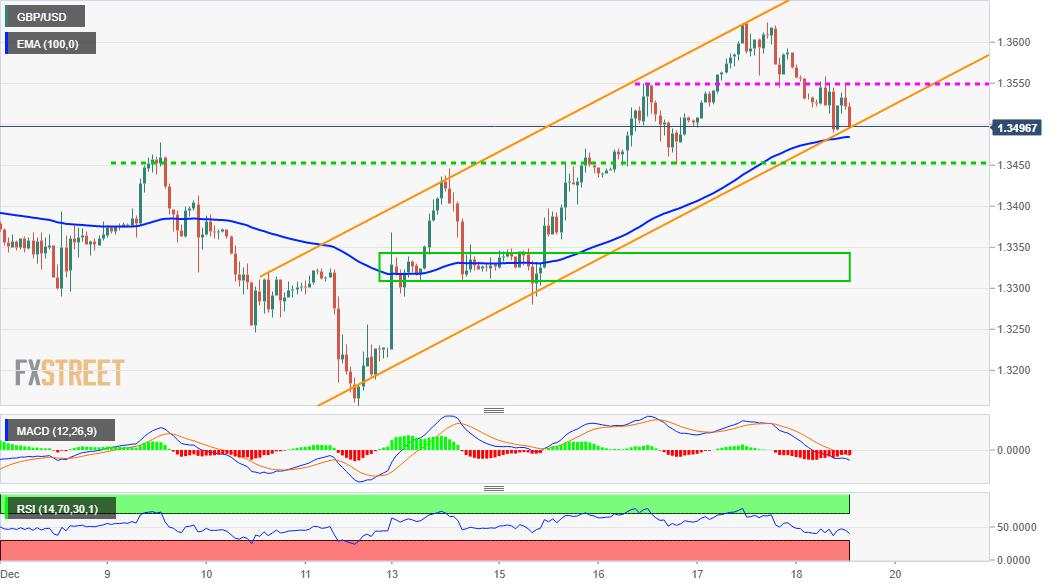
The GBP/USD pair maintained its offered tone through the early North American session, with bears making a fresh attempt to extend the downfall further below the 1.3500 mark.
The mentioned level represents a confluence support, comprising of 100-hour EMA and the lower boundary of weekly ascending trend-channel. A convincing break below should pave the way for an extension of the ongoing corrective slide from multi-year tops set on Thursday.
Meanwhile, technical indicators on the 1-hourly chart have been drifting lower in the bearish territory and losing traction on the 4-hourly chart. However, oscillators on the daily chart maintained their bullish bias and warrant caution for aggressive bearish traders.
However, a convincing breakthrough the mentioned confluence support could still accelerate the fall to the 1.3455-50 support. Some follow-through selling might turn the GBP/USD pair vulnerable to slide further below the 1.3400 mark, towards the 1.3340-20 congestion zone.
On the flip side, the 1.3550-55 region now seems to have emerged as immediate resistance. A sustained move beyond has the potential to push the GBP/USD pair back towards the 1.3600 round-figure mark, en-route YTD tops, around the 1.3625 region.
GBP/USD 1-hourly chart
Technical levels to watch
