- GBP/USD nears three-week top, recently bounced off 1.2600.
- A successful trading above the key EMA enables the quote to confront a three-month-old horizontal resistance.
- 61.8% Fibonacci retracement adds to the downside support.
GBP/USD remains on the front foot around 1.2613 during the early Asian session on Thursday. In doing so, the Cable keeps the previous day’s break above 200-day EMA. As a result, the bulls are targeting a horizontal area comprising multiple highs marked since April 14.
Other than the 1.2645/55 immediate resistance region, the early-June top of 1.2730 and 1.2800 round-figure may act as buffers ahead of the June 10 peak of 1.2813.
It’s worth mentioning that the pair’s rise past-1.2813 could aim for 1.3000 psychological magnet before refreshing the yearly top beyond 1.3200.
Meanwhile, a daily close below 200-day EMA level of 1.2590 could drag the quote to 61.8% of Fibonacci retracement of March month’s fall near 1.2515.
Also acting as the near-term key supports will be July 03 bottom near 1.2440 and June 22 low surrounding 1.2330.
GBP/USD daily chart
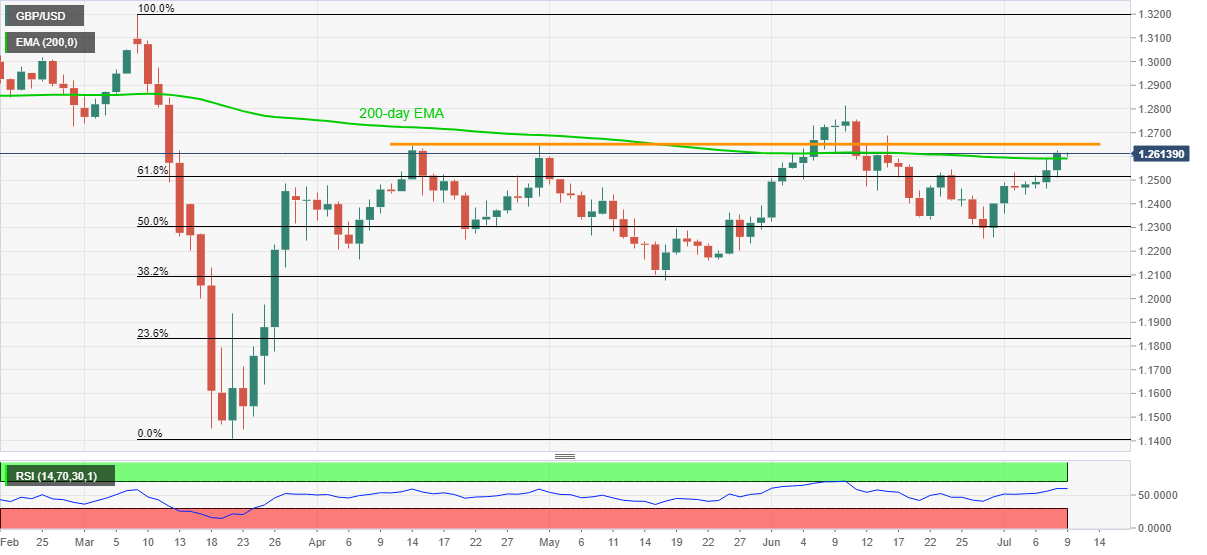
Trend: Bullish
