- GBP/USD snaps two-day losing streak while recovering from 1.2185.
- 61.8% Fibonacci retracement can offer intermediate resistance.
- Downside break of the triangle will recall sub-1.2100 area on the charts.
- UK Retail Sales for April become the key fundamental catalyst.
GBP/USD extends recovery moves from 1.2185 while taking the bids near 1.2230, up 0.10% on a day, amid the early Friday trading.
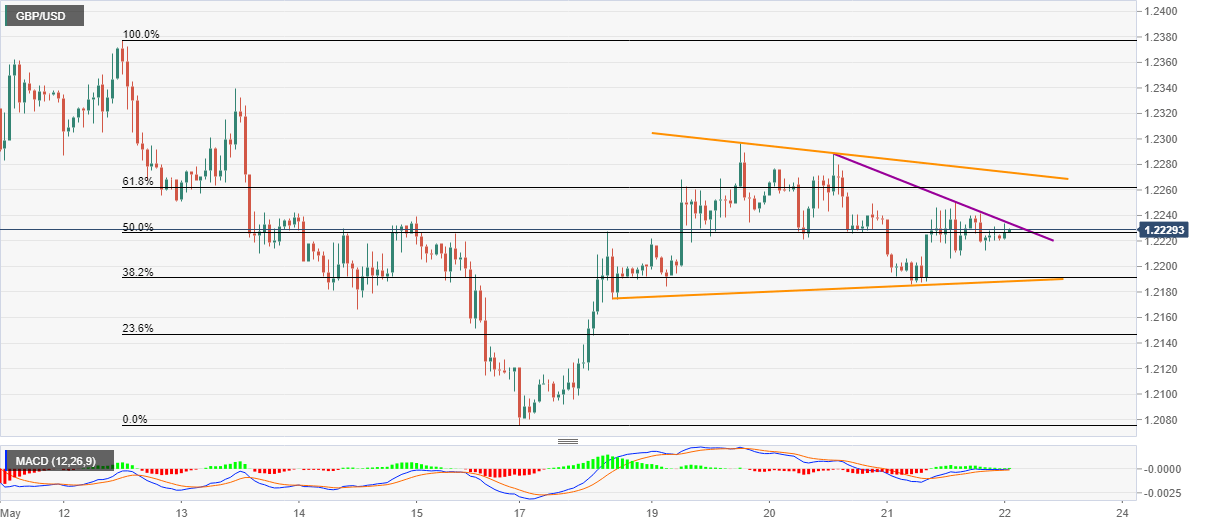
Looking at the Cable’s moves from late-Monday, a short-term falling triangle seems to appear on the hourly (H1) chart. That said, the quote presently confronts an intermediate resistance line, around 1.2235, following the bounce from the formation’s support.
Also Read: UK Retail Sales Preview: Will a third fall finally fell the pound? Yearly figure may steal the show
Should the pullback cross 1.2235, 61.8% Fibonacci retracement level of May 12-17 fall near 1.2265 can offer extra resistance before fueling the pair towards the pattern’s upper line, at 1.2275 now.
It should also be noted that the pair’s rise past-1.2275 enables it to cross 1.2300 round-figure and aim for May 13 high near 1.2340 before rising further.
On the downside, the pair’s declines below 1.2185 support can wait for the validation from the 1.2170 rest-point, which if broken can drag the quote to the monthly low surrounding 1.2075.
GBP/USD hourly chart
Trend: Further recovery expected
