- GBP/USD pulls back from the weekly high, takes a U-turn from near-term key resistance line.
- 23.6% Fibonacci retracement, six-week-old rising trend line are on sellers’ radar.
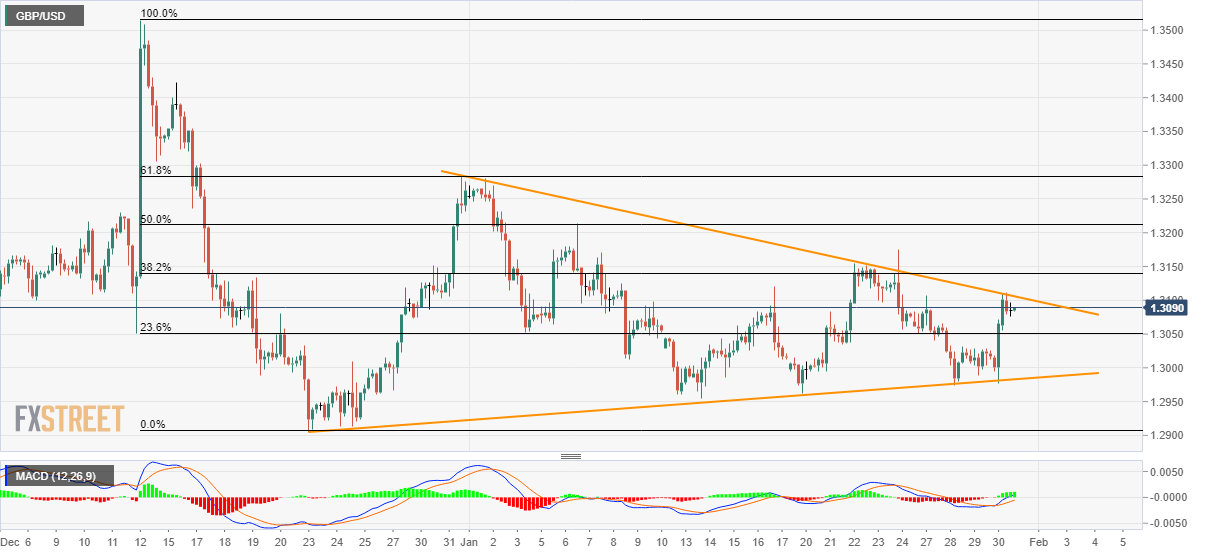
GBP/USD remains modestly changed to 1.3090 during the Asian session on Friday. The pair earlier bounced off a multi-week-old support line on the back of the BOE decision. However, bulls failed to cross near-term key resistance.
Even so, the bullish MACD could keep the risk of pair’s run-up towards 50% Fibonacci retracement of December 13-23 run-up, at 1.3212, on the break of 1.3110 trend line resistance.
If at all bulls manage to hold the reins past-1.3212, 61.8% Fibonacci retracement and December 16 high, near 1.3285 and 1.3425 respectively, could lure the bulls.
Meanwhile, 23.6% Fibonacci retracement level of 1.3050 and a six-week-old rising trend line at 1.2980 will keep the pair’s short-term declines limited.
Though, a sustained break of 1.2980 might note refrain from calling 1.2900 back to the charts.
GBP/USD four-hour chart
Trend: Pullback expected
