- GBP/USD registers four-day losing streak, stays near five-month low.
- Bearish MACD, sustained break of 61.8% Fibonacci retracement keep sellers hopeful.
- Buyers will need to regain footing above 200-day SMA.
GBP/USD remains under pressure around 1.2520, down 0.40%, amid the Asian session on Friday. In doing so, the quote extends losses under 61.8% Fibonacci retracement level of its September-December 2019 upside amid bearish MACD. That said, the pair is likely to remain weak unless bouncing back beyond 200-day SMA.
As a result, the sellers can aim for early October 2019 high near 1.2415 if the GBP/USD prices remain weak below 1.2500.
In a case the bears fail to respect the 1.2415 rest-point, October 2019 bottom surrounding 1.2195 will be on their radars.
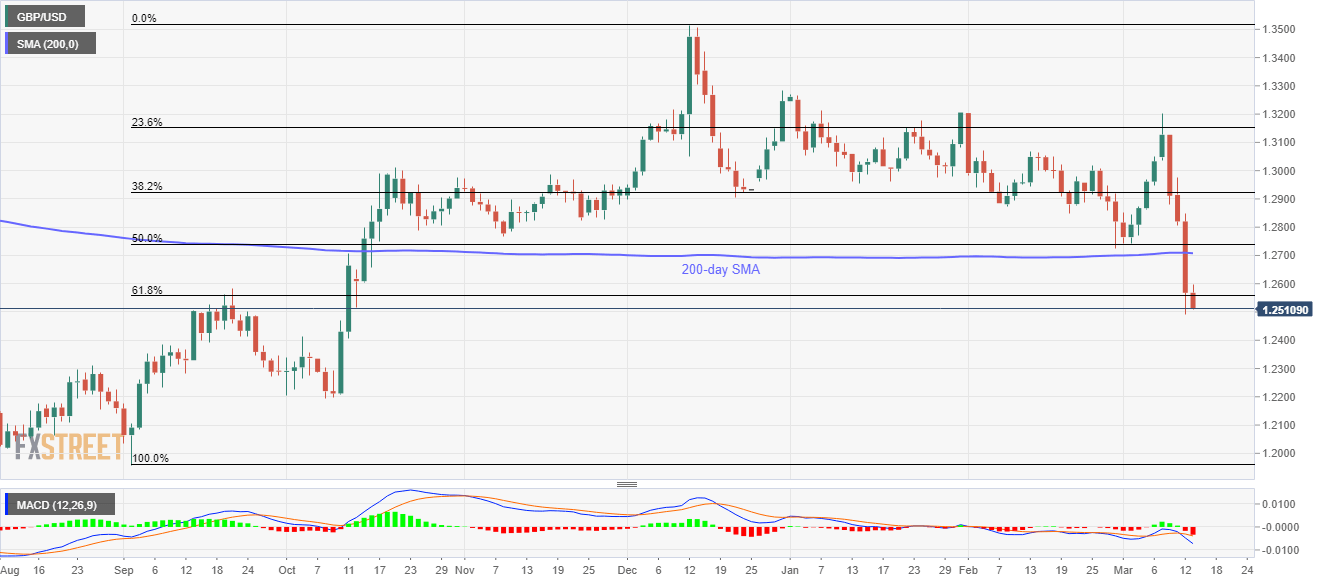
Alternatively, a 61.8% Fibonacci retracement level of 1.2560 can act as the immediate resistance ahead of a 200-day SMA level of 1.2710.
It should, however, be noted that February month low near 1.2725 and 50% Fibonacci retracement near 1.2740 can question the bulls afterward.
GBP/USD daily chart
Trend: Bearish
