- GBP/USD struggles to extend late-Wednesday’s recovery moves, eases off-late.
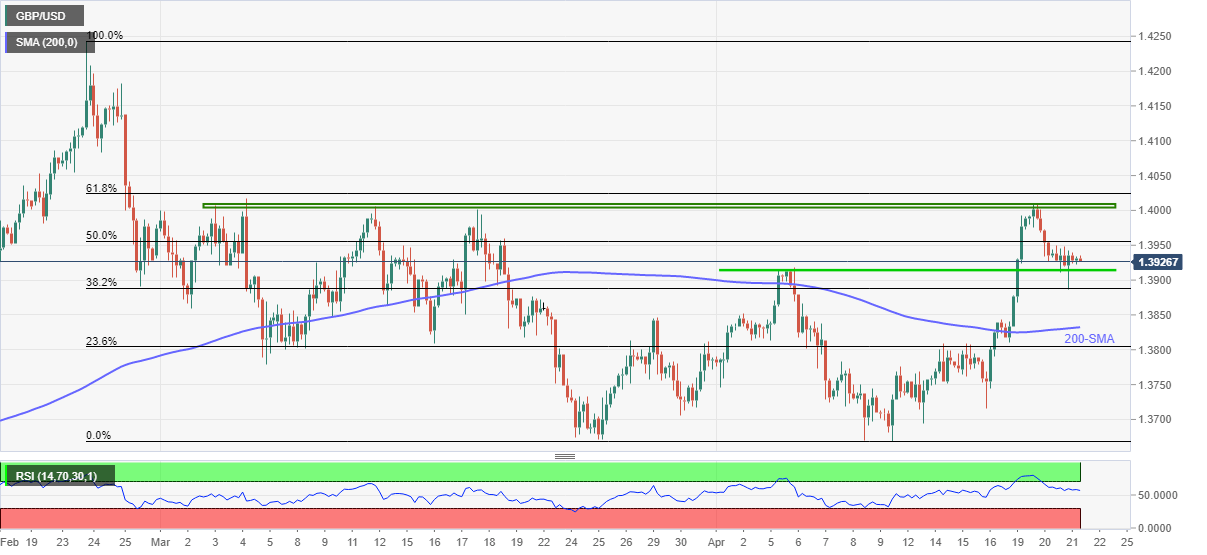
- Key Fibonacci retracement levels, seven-week-old horizontal hurdle to test the bounce off weekly support.
- Strong RSI, sustained trading beyond 200-SMA back the bulls.
GBP/USD cools down to 1.3930, fails to stretch the previous day’s U-turn from 1.3885, amid Thursday’s Asian session.
The cable followed strong RSI and successful trading above 200-SMA, crossed on Monday, to bounce off a one-week-old horizontal area during late Wednesday.
However, the corrective pullback will soon hit the first hurdle, namely 50% Fibonacci retracement of February-April downside, around 1.3960.
Even if the quote manages to cross the immediate resistance, the key horizontal area established since early March and 61.8% Fibonacci retracement level, respectively near 1.4010 and 1.4020, will test the GBP/USD bulls.
Meanwhile, downside moves below the nearby horizontal support around 1.3910 will aim for a 200-SMA level of 1.3915.
Overall, GBP/USD is likely to remain firm but the upside momentum has a bumpy road ahead.
GBP/USD four-hour chart
Trend: Further recovery expected
