- GBP/USD fails to register noticeable moves following a Tuesday’s Doji candlestick.
- Short-term moves are confined between 50 and 100-day SMA, 61.8% Fibonacci retracement offers immediate resistance.
- The monthly bottom can please sellers below 100-day SMA.
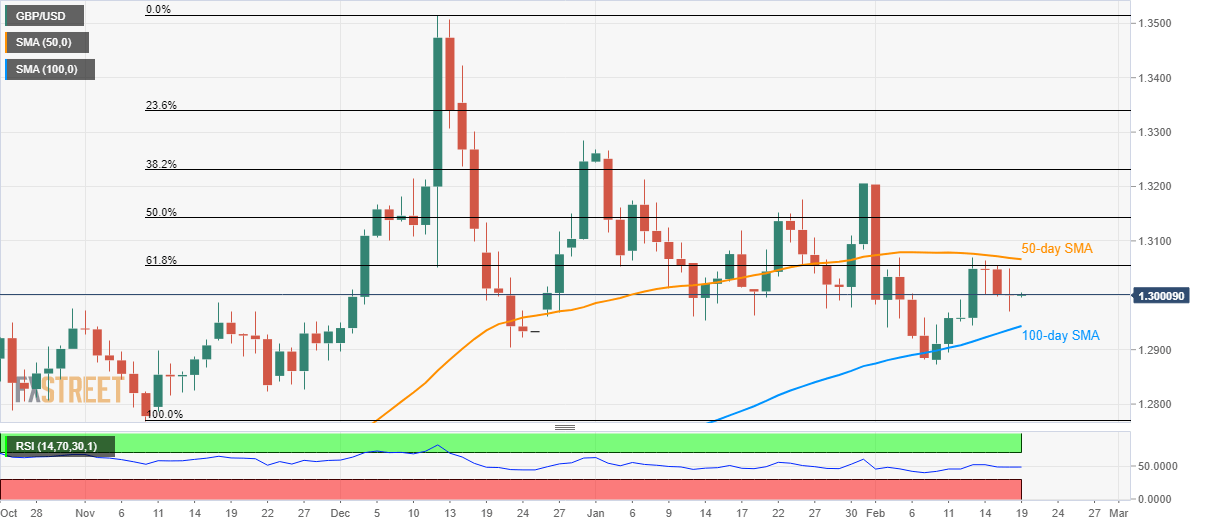
GBP/USD remains a little changed below 1.3000 during early Wednesday. The cable posted a trend reversal Doji candlestick formation the previous day. Though, 50-day and 100-day SMA continue to restrict near-term moves.
While the recent Doji favors the pair’s pullback, 61.8% Fibonacci retracement of its November-December 2019 upside, at 1.3055, could lure the buyers ahead of making them confront 50-day SMA level of 1.3067.
In a case buyers manage to cross 1.3067, 50% Fibonacci retracement level of 1.3142 and 1.3200 could return to the charts.
On the flip side, the pairs’ declines below 100-day SMA, at 1.2945 now, can challenge the monthly bottom near 1.2870.
Should there be a further price weakness beneath 1.2870, 1.2820 and November 2019 low around 1.2770 could gain the bears’ attention.
GBP/USD daily chart
Trend: Sideways
