- GBP/USD is consolidating the bullish breakout above the 1.3100 handle.
- The level to beat for bulls is the 1.3172 resistance.
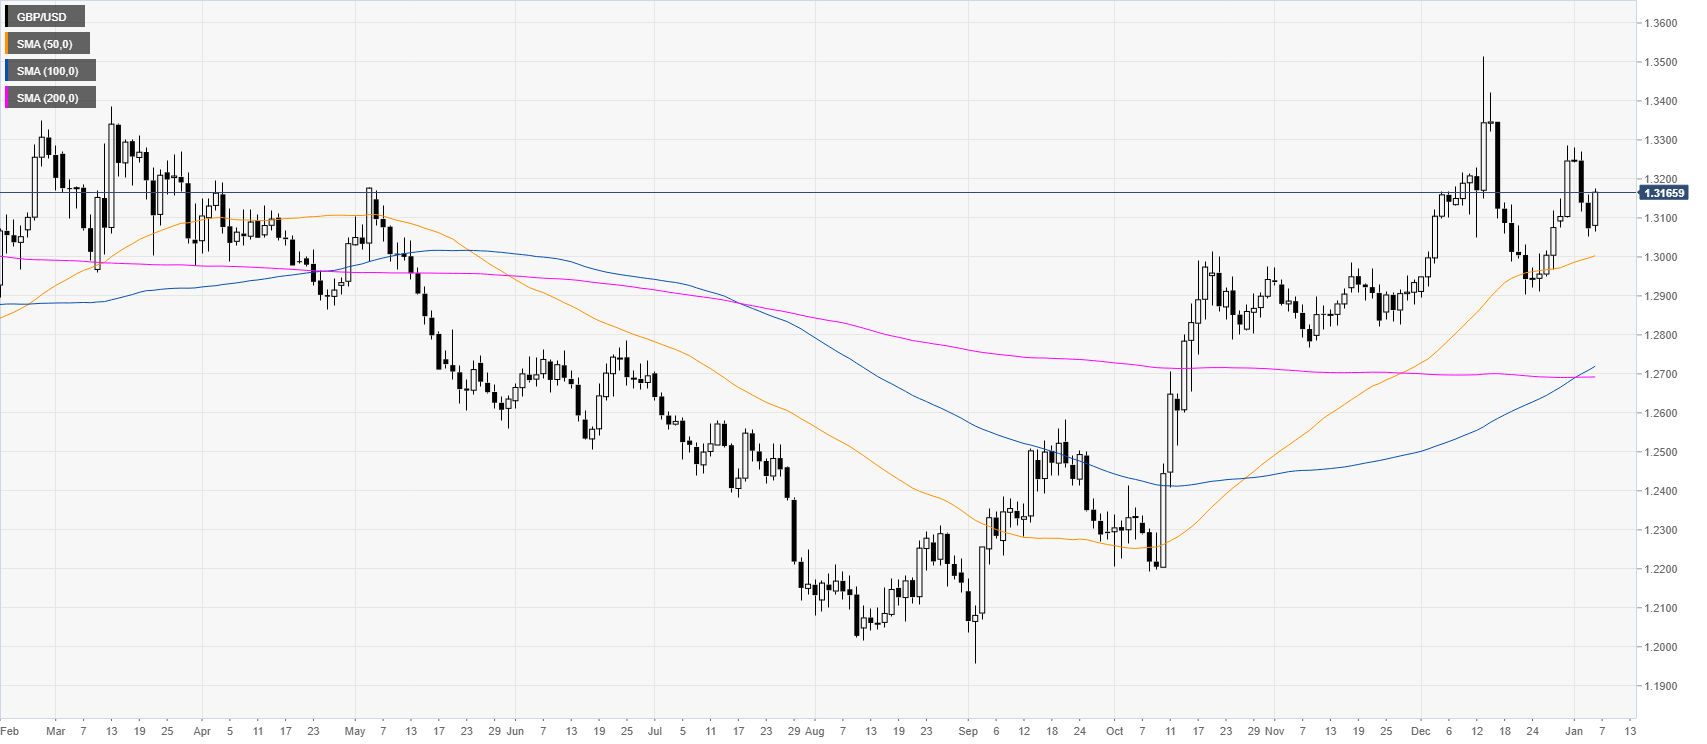
GBP/USD daily chart
GBP/USD is trading in a bullish channel above the main SMAs. However, the year started with a potential lower high just below the 1.3300 hanlde that bulls will need to overcome.
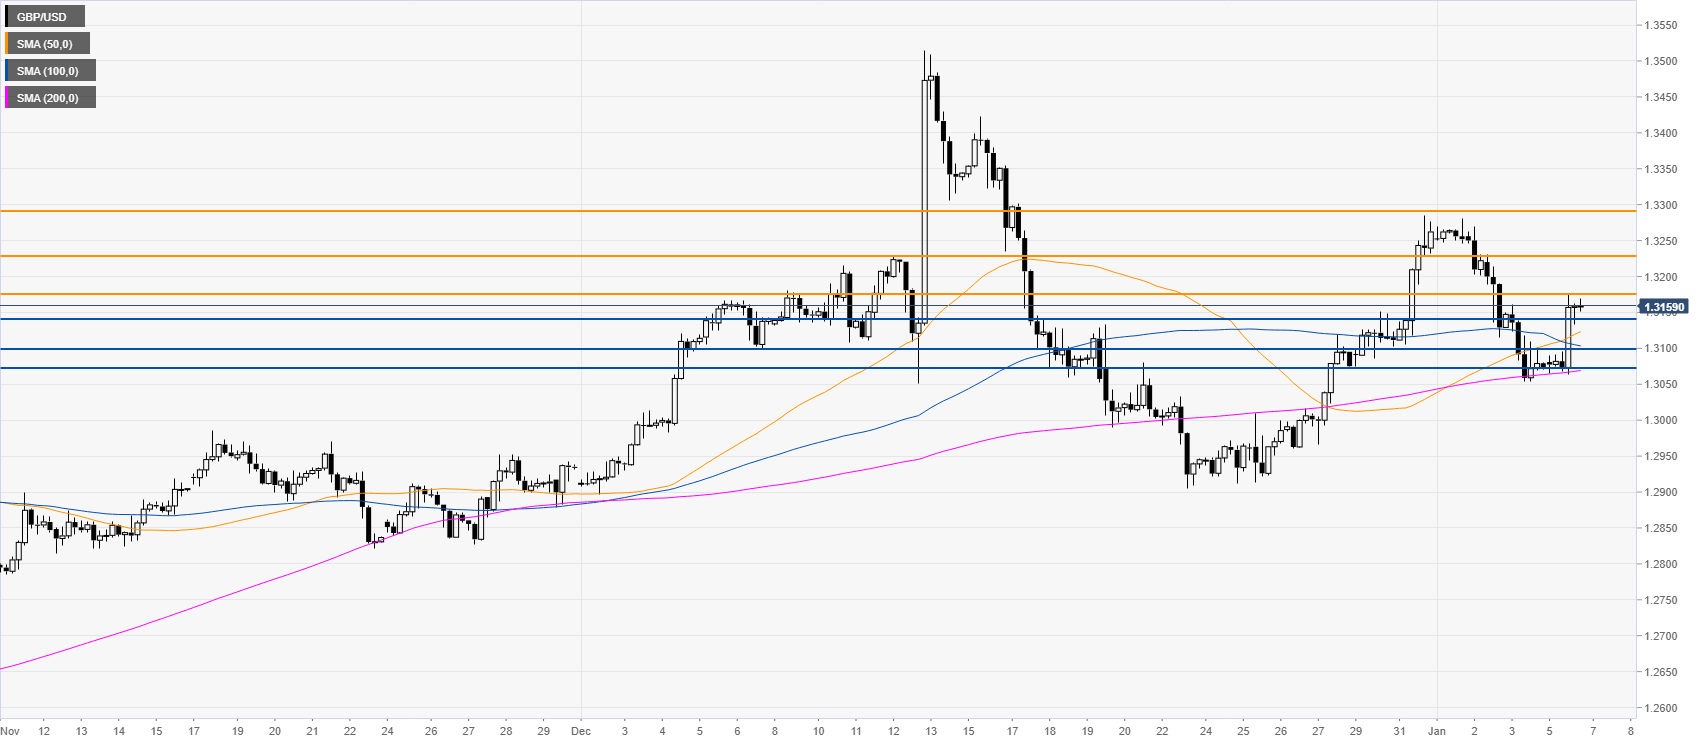
GBP/USD four-hour chart
The market is pressuring the 1.3172 resistance level while trading above the main SMAs on the four-hour chart. Buyers want to capitalize on the recent bullish breakout and break the 1.3172 level to drive the quote towards the 1.3227 and 1.3290 levels, according to the Technical Confluences Indicator. On the flip side, bears could take the lead on a break below the 1.3144 level. Further down lie the 1.3100/1.3076 support zone.
Additional key levels
