- GBP/USD is trading in four-month lows, nearing the 1.2700 figure.
- GBP/USD could extend losses towards the 1.2657 and 1.2600 levels.
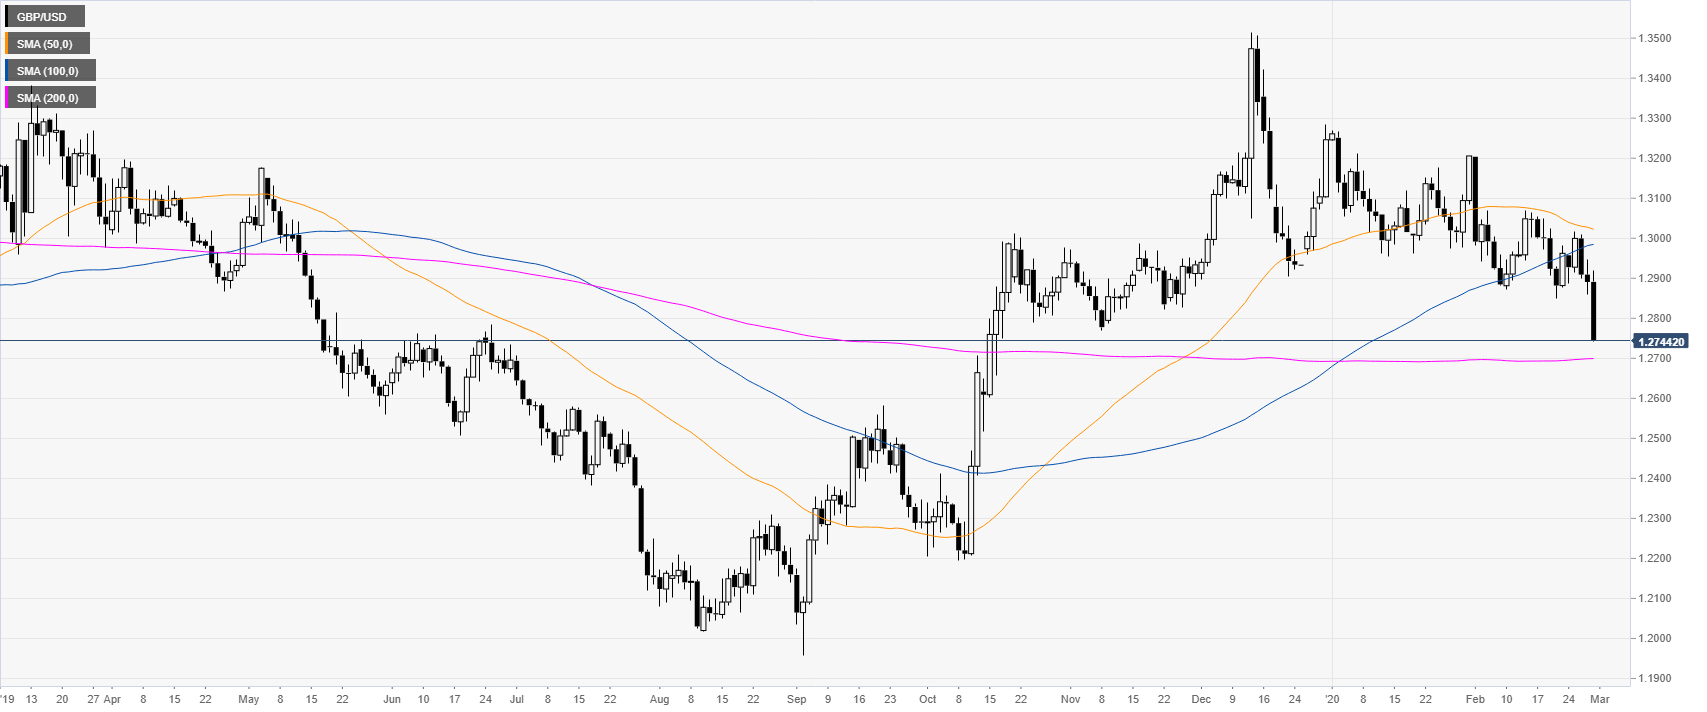
GBP/USD daily chart
GBP/USD is dropping below the 1.2800 figure and the 50/100-day simple moving averages (SMAs) as the market is trading at levels not seen since October 2019.
GBP/USD four-hour chart
Pound/Dollar is dropping sharply while nearing the 1.2700 figure. The currency pair remains under pressure below its main SMAs. Downside targets can be seen near the 1.2700, 1.2657 and 1.2600 levels. On the flip side, bullish attempts could find resistance near the 1.2820, 1.2858 and 1.2900 levels, according to the Technical Confluences Indicator.
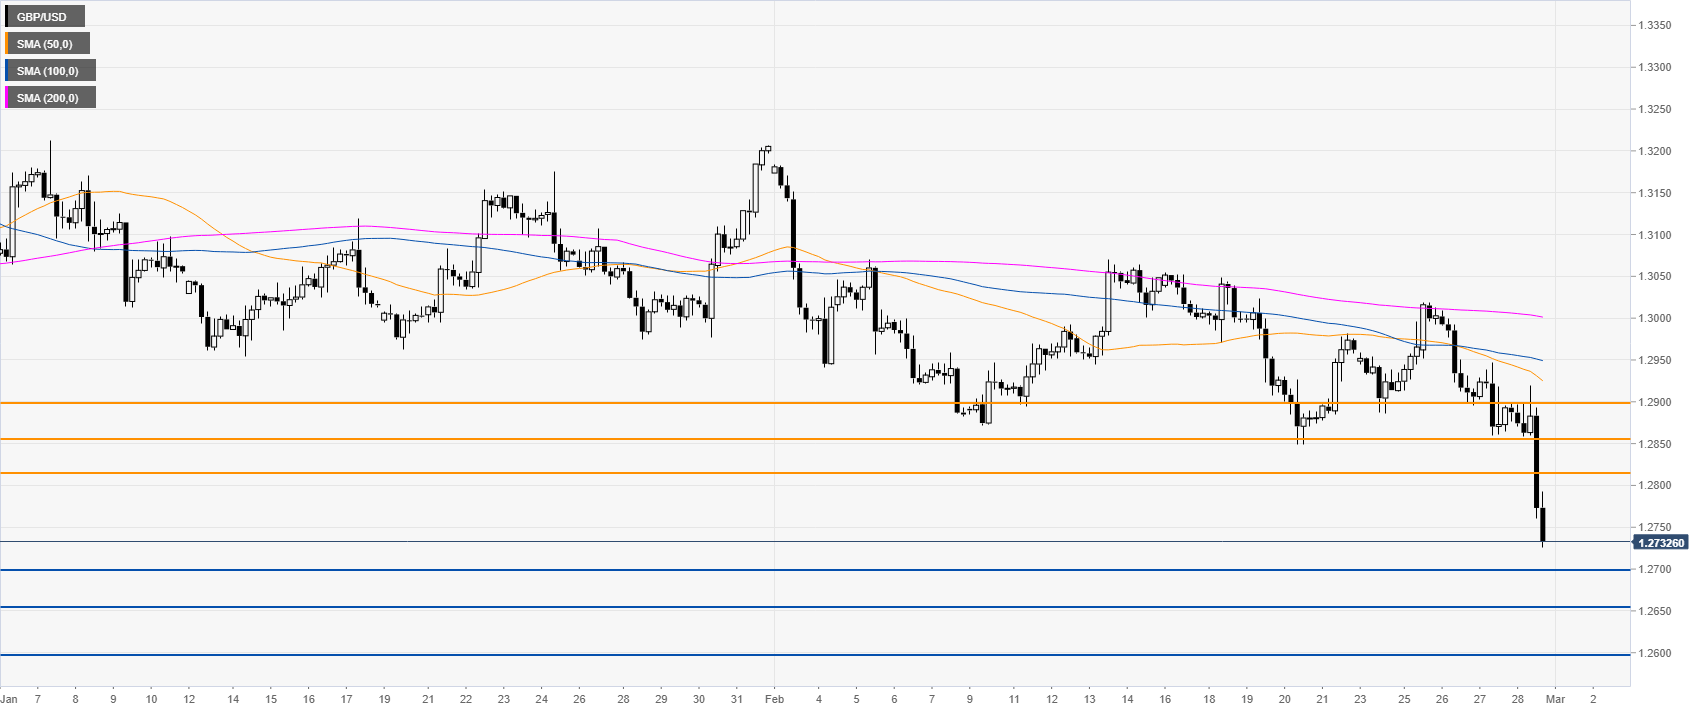
Resistance: 1.2820, 1.2858, 1.2900
Support: 1.2700, 1.2657, 1.2600
Additional key levels
