- GBP/USD holds onto recovery gains from 1.2389.
- Bullish candlestick near four-day low, normal RSI favor further recovery.
- 50-day and 100-day EMAs offer additional upside barriers.
- Monthly low offers strong support under 1.2400.
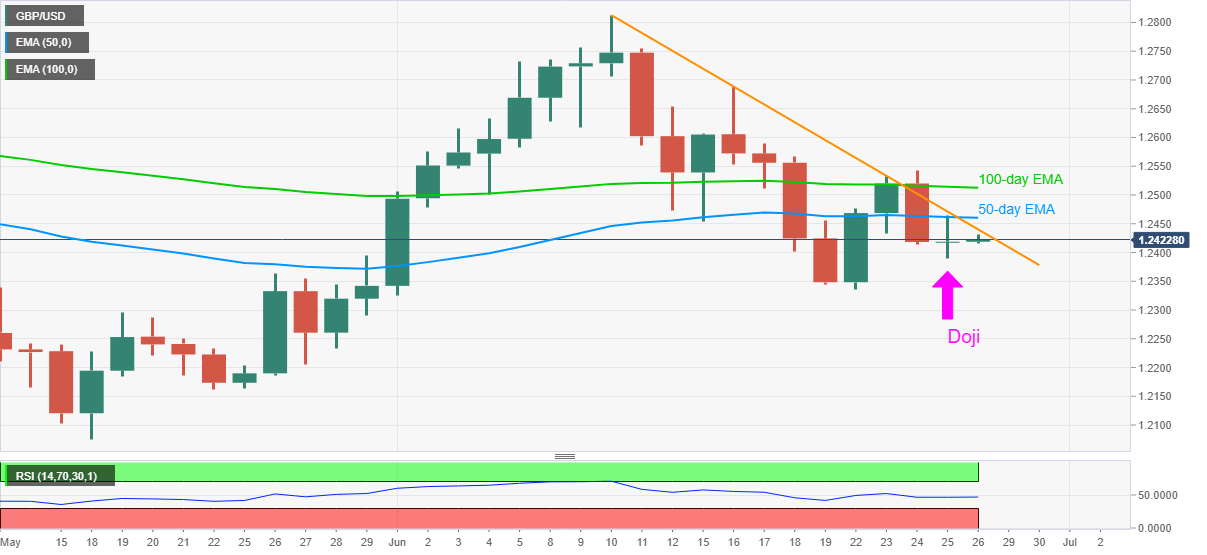
GBP/USD recedes from the intraday high of 1.2430 to 1.2421 as Tokyo opens for trading on Friday. Even so, the Cable carries the previous day’s pullback to near a descending resistance line while justifying the bullish Doji formation on the daily chart.
Considering the pair’s U-turn backed by normal RSI conditions, the quote might cross the nearby upside barrier, at 1.2440 now. However, 50-day EMA, at 1.2460, could challenge the further upside.
In a case where the bulls dominate past-1.2460, a 10-day EMA level of 1.2512 and Wednesday’s top near 1.2545 could flash on their radars.
Alternatively, the pair’s declines below Thursday’s low of 1.2389 could again attack the monthly bottom surrounding 1.2325 and May 19 top near 1.2300.
GBP/USD daily chart
Trend: Further recovery expected
