- GBP/USD snaps two-day winning streak.
- The early-week top, 100-HMA act as immediate supports, 61.8% Fibonacci retracement adds to the resistance.
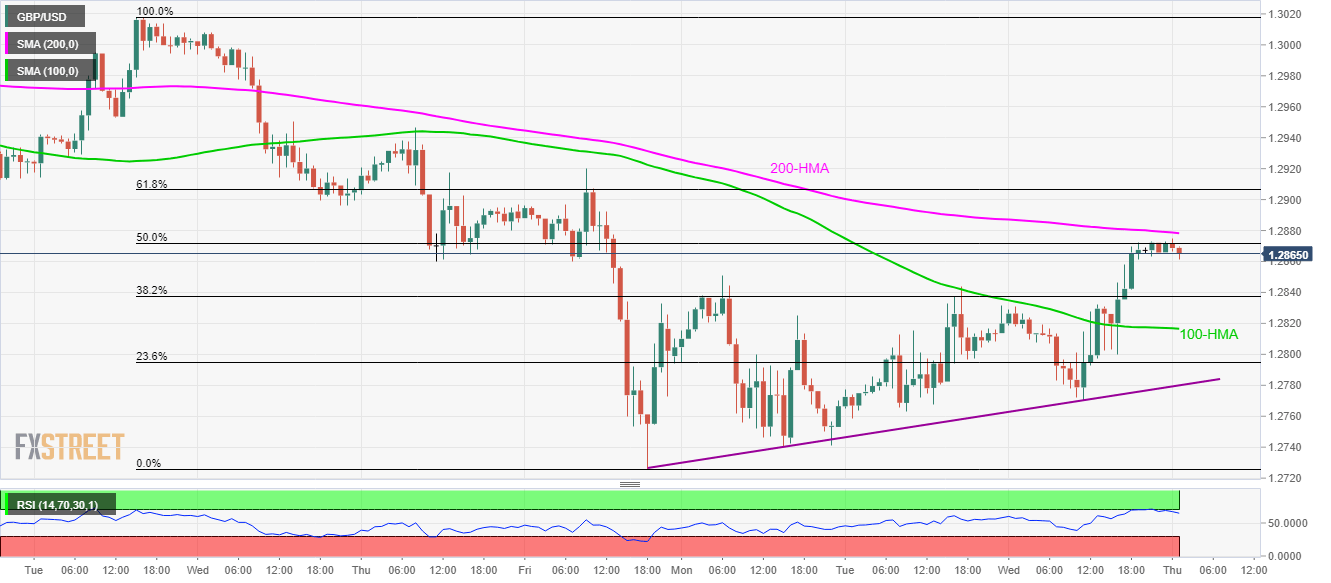
With the failures to cross 200-HMA amid overbought RSI conditions, GBP/USD declines to 1.2865 during the early Thursday’s trading.
The pair is currently expected to stretch the pullback towards Monday’s high surrounding 1.2850 whereas 100-Hour Moving Average (HMA) near 1.2815 could question the quote’s further downside.
During the Cable’s weakness past-1.2815, an ascending trend line from Friday, at 1.2780 now, will be the key to watch.
Meanwhile, a sustained break of 200-HMA level of 1.2880 propels the GBP/USD prices towards 61.8% Fibonacci retracement of February 25-28 declines, at 1.2907.
Additionally, buyers can target 1.2945/50 and 1.3000 in a case if they manage to ignore overbought RSI conditions beyond 1.2907.
GBP/USD hourly chart
Trend: Pullback expected
