- GBP/USD added to the overnight strong move up and gained traction for the second straight day.
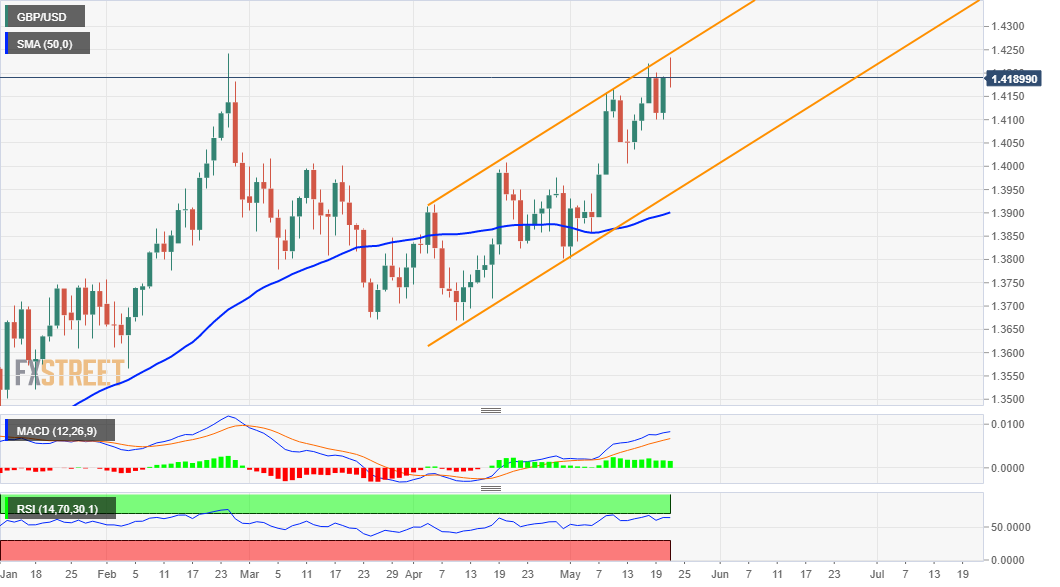
- The intraday uptick stalled near a resistance marked by the top end of an ascending trend channel.
- The set-up seems titled in favour of bullish traders and supports prospects for an eventual breakout.
The GBP/USD pair shot to fresh three-month tops during the mid-European session, albeit quickly retreated few pips thereafter. The pair was last seen trading just below the 1.4200 mark, nearly unchanged for the day.
Following a brief consolidation through the first part of the trading action on Friday, the pair turned positive for the second consecutive session and built on the overnight strong move up. The US dollar struggled to gain any meaningful traction and languished near multi-month lows. This, along with mostly upbeat UK macro data, provided a modest lift to the GBP/USD pair.
Looking at the technical picture, the intraday uptick stalled near a resistance marked by the top boundary of a short-term ascending channel extending from lows touched in March and April. The mentioned barrier, currently around the 1.4235 region, coincides with YTD tops touched on February 24. This, in turn, should now act as a key pivotal point for short-term traders.
Meanwhile, technical indicators on the daily chart maintained their bullish bias and are still far from being in the overbought territory. The technical set-up seems tilted firmly in favour of bullish traders and supports prospects for an eventual breakout to the upside. That said, bulls might still wait for a sustained move beyond the 1.4235 area before placing fresh bets.
The GBP/USD pair might then aim to reclaim the 1.4300 round-figure mark and prolong the upward trajectory further towards 2018 yearly tops, around the 1.4375 region.
On the flip side, the daily swing lows, around the 1.4170-65 region now seems to protect the immediate downside. Sustained weakness below might turn the GBP/USD pair vulnerable to accelerate the fall back towards the 1.4100 mark. This is followed by weekly lows, around the 1.4075 region, which if broken will negate the constructive outlook and prompt some technical selling.
GBP/USD daily chart
Technical levels to watch

