- GBP/USD seesaws near the highest since December 16, 2019, eases from 1.3368 off-late.
- Bullish MACD suggests further upside towards the short-term resistance line.
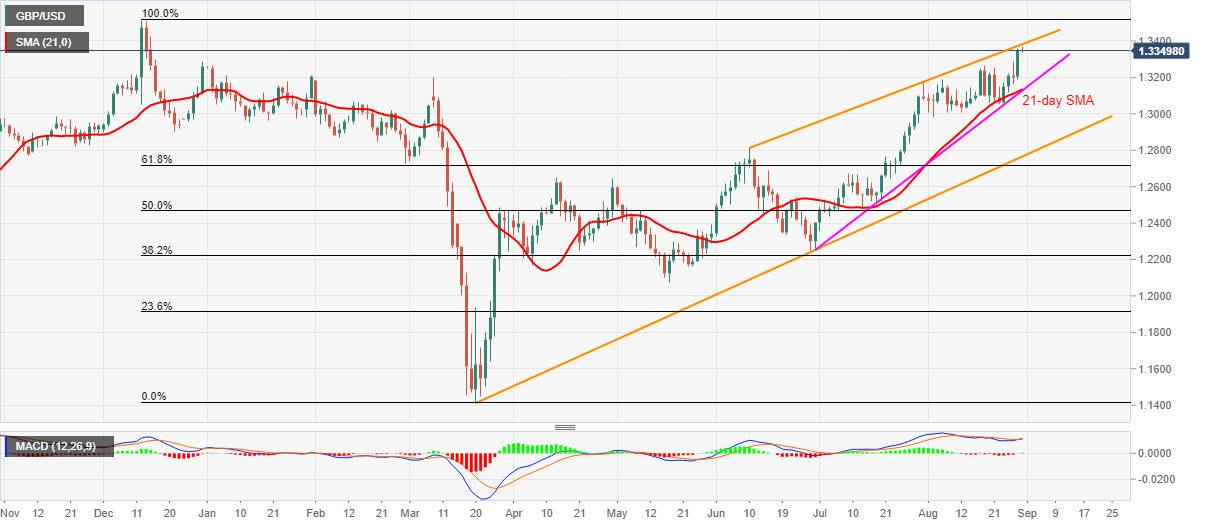
- 21-day SMA, a two-month-old ascending trend line offer strong downside support.
GBP/USD recedes from the year’s top of 1.3368 to 1.3351 amid the initial hour of Tokyo open on Monday. Even so, MACD teases the bulls while 21-day SMA joins an ascending trend line from June 30 to restrict the pair’s short-term downside.
Hence, bulls can keep the reins and attack an upward sloping trend line from the early June month, at 1.3383 now, while targeting December 2019 peak near 1.3515 as the next level.
During the pair’s upside past-1.3515, 1.3620 and September 2017 high near 1.3660 can challenge the Cable buyers.
Meanwhile, any downside below March month’s top around 1.3200 will fetch the quote to 1.3130 support confluence including 21-day SMA and the aforementioned trend line.
Even if the pair slips below 1.3130, the 1.3000 threshold and the monthly low around 1.2980 will be restricting the additional south-run.
GBP/USD daily chart
Trend: Pullback expected
