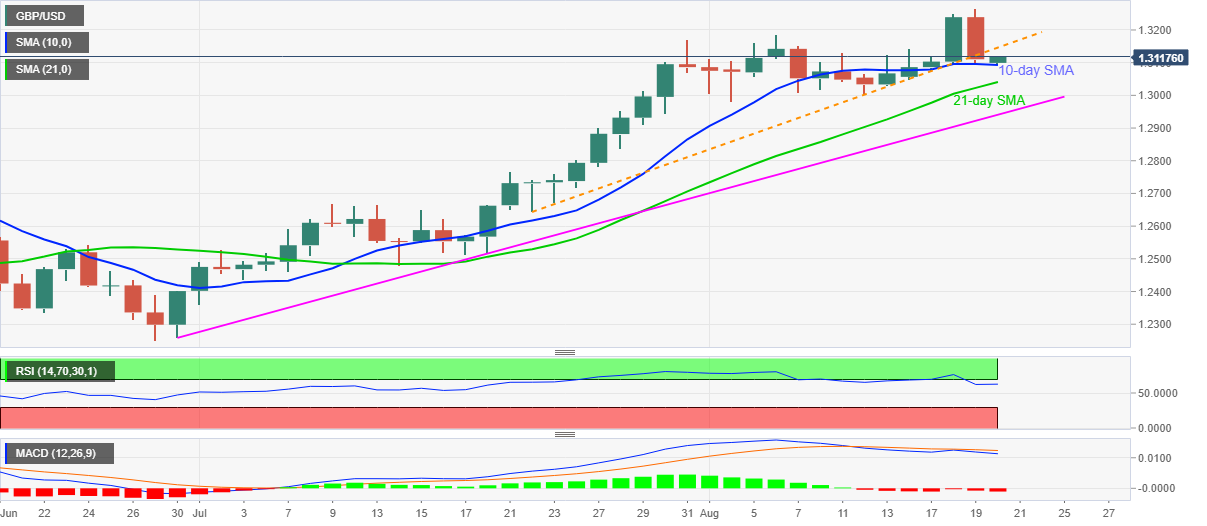
- GBP/USD consolidates the biggest losses in 10 weeks.
- RSI normalization suggests further recovery moves, MACD highlights 21-day SMA, 1.5-month-old support line.
- Multiple resistances past-1.3200 exert additional pressure on the bulls.
GBP/USD remains mildly bid while extending recoveries from 1.3095 to 1.3110 during the pre-Tokyo open trading on Thursday. The Cable’s recent recovery takes clues from 10-day SMA following the previous day’s pullback from the yearly high.
While RSI recedes from overbought conditions and suggests no major challenges to the latest pullback, the pair’s sustained trading below an ascending trend line from July 22 keeps the bears hopeful. Further strengthening the case for the quote’s downside is the bumpy road beyond 1.3200.
As a result, sellers await a clear break below the 10-day SMA level of 1.3093 to attack 1.3040 mark comprising 21-day SMA. However, an upward sloping support line from June 30, at 1.2940 now, may challenge the additional south run.
Meanwhile, an upside break of the support-turned-resistance trend line, currently around 1.3145 will again aim for 1.3200 and the December 31, 2019 high of 1.3285 ahead of recalling 1.3300 level back to the chart.
Should the bulls keep the reins after 1.3300, the year 2019 peak surrounding 1.3515 will be in the spotlight.
GBP/USD daily chart
Trend: Pullback expected

