- GBP/USD shot to two-week tops, around 38.2% Fibo. level during the mid-European session.
- The set-up favours bullish traders and supports prospects for a move beyond the 1.3000 mark.
- Any meaningful dip might continue to find decent support near the 1.2900 confluence region.
The GBP/USD pair continued gaining traction through the mid-European session and climbed to two-week tops, around the 1.2980 region in the last hour.
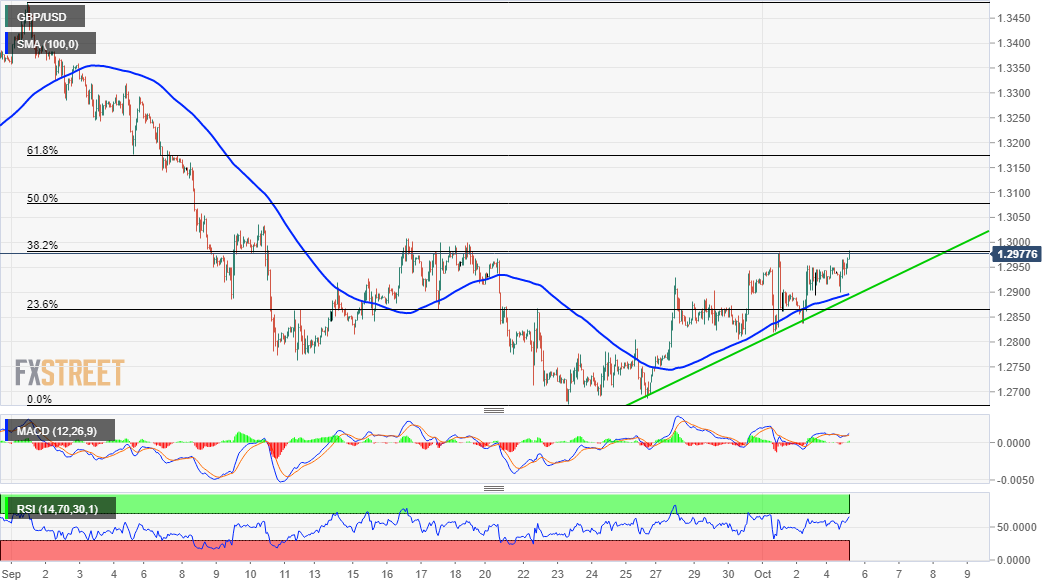
Looking at the technical picture, the recent bounce from multi-week lows has been along an upward-sloping trend-line. The mentioned support coincides with 100-hour SMA and should act as a key pivotal point for short-term traders.
The pair has now moved back closer to a resistance marked by the 38.2% Fibonacci level of 1.3482-1.2676 recent downfall. Meanwhile, oscillators on hourly charts maintained their bullish bias and have also recovered from the negative territory on the daily chart.
A subsequent move beyond the key 1.3000 psychological mark will be seen as a fresh trigger for bullish traders. The GBP/USD pair might then aim to reclaim the 1.3100 mark and extend the momentum further towards the 61.8% Fibo. level, around the 1.3160-70 region.
On the flip side, the 1.2950 horizontal zone now seems to protect the immediate downside, which if broken might turn the GBP/USD pair vulnerable to slide back towards the 1.2900 confluence support. Some follow-through selling will negate prospects for any further gains.
GBP/USD 1-hourly chart
Technical levels to watch
