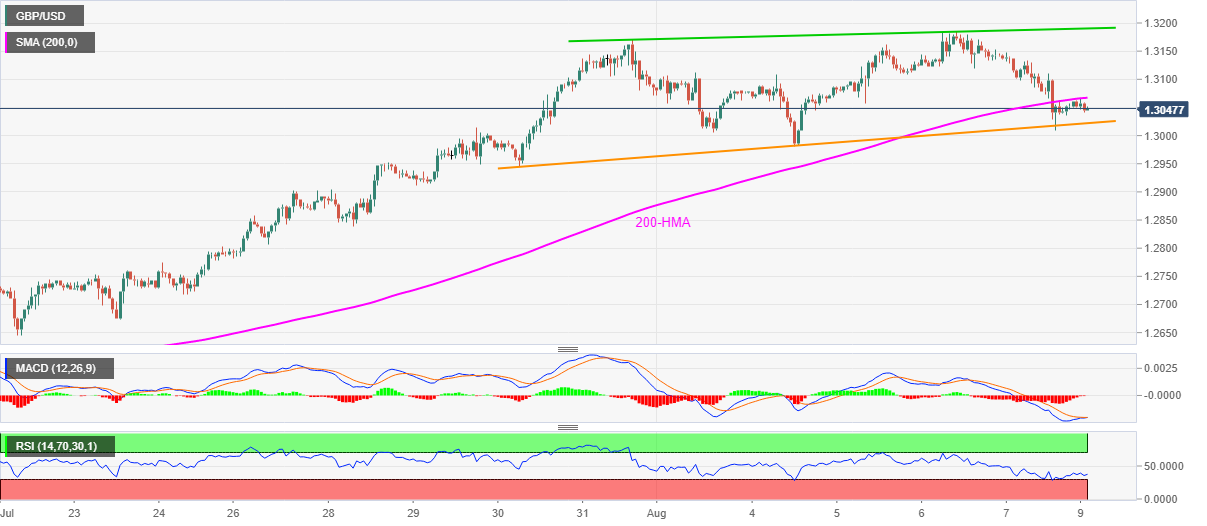
- GBP/USD pair’s pullback from 1.3009 reverses from 1.3065.
- Sustained trading below 200-HMA keeps sellers hopeful.
- Bulls will retake controls beyond the monthly resistance line.
GBP/USD seesaws around 1.3050 during the early Monday’s Asian session. In doing so, the Cable trims gains following a U-turn from a seven-day-old support line. The reason could be traced from the pair’s inability to cross 200-HMA.
Other than the 200-HMA and immediate support line, weak RSI conditions and lingering MACD also raise questions for the pair traders. As a result, they look for a clear break of any of these key technical levels for fresh directions.
While an upside break of 200-HMA, at 1.3067 now, can aim for 1.3100, the pair’s further upside will be challenged by an ascending trend line from July 31, currently around 1.3190.
On the contrary, a downside break below the mentioned support line, near 1.3020, can attack the 1.3000 threshold to revisit July 28 top near 1.2950.
It should also be noted that the pair’s rise past-1.3190 will need validation from 1.3200 before recalling the bulls. Meanwhile, the bears’ dominance past-1.2950 can highlight 1.2840/35 support-zone.
GBP/USD hourly chart
Trend: Sideways

