- GBP/USD witnessed a modest pullback on Monday and eroded a major part of Friday’s gains.
- Mixed technical indicators warrant caution before positioning for any firm near-term direction.
The GBP/USD pair stalled its post-BoE strong positive move near the 1.3740 region and witnessed a modest pullback from over one-week tops set earlier this Monday.
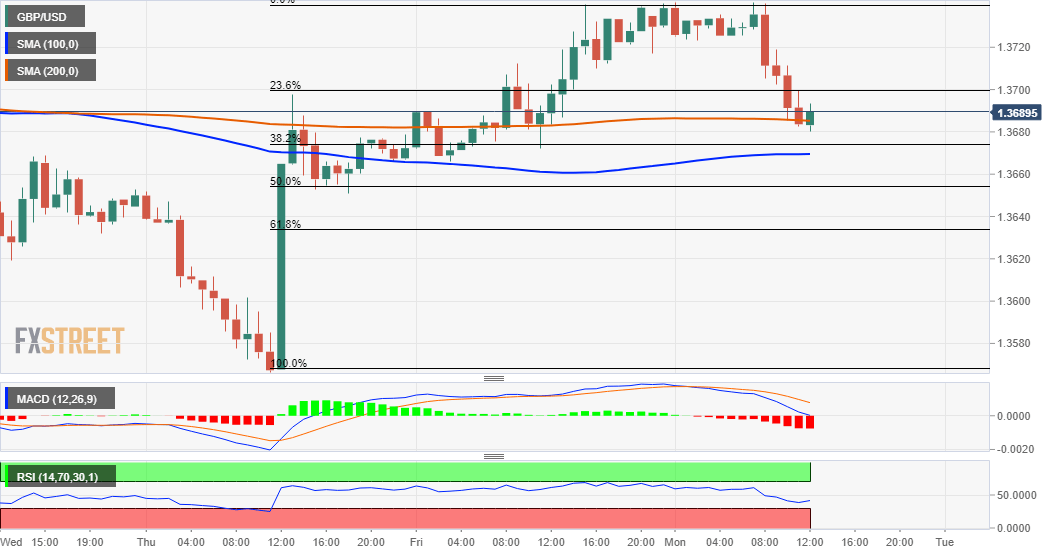
The pair has now eroded a major part of the previous session’s positive move, though showed some resilience below the 200-hour SMA. This is followed by 100-hour SMA, around the 1.3670 region, which coincides with the 38.2% Fibonacci level of the 1.3567-1.3741 positive move and should act as a key pivotal point for short-term traders.
Meanwhile, technical indicators on the 1-hourly chart have been drifting lower in the bearish territory and losing positive momentum on the 4-hourly chart. However, oscillators on the daily chart are still holding in the positive territory, warranting some caution before positioning for any further depreciating move for the GBP/USD pair.
That said, sustained weakness below the 1.3670 confluence support might prompt some technical selling and turn the GBP/USD pair vulnerable to accelerate the fall back towards the 1.3600 round-figure mark. Some follow-through selling has the potential to drag the pair back towards last week’s swing lows, around the 1.3565 region.
On the flip side, the 1.3735-40 region might now act as an immediate resistance ahead of the 1.3755-60 congestion zone, or multi-year tops. A sustained strength beyond will negate any near-term bearish bias and set the stage for additional gains. The GBP/USD pair might then aim to reclaim the 1.3800 mark for the first time since April 2018.
GBP/USD 1-hourly chart
Technical levels to watch
