- GBP/USD consolidates the corrective bounce amid USD pullback.
- Teasing a symmetrical triangle breakout on the hourly chart
- Hourly RSI points north in the bullish territory.
GBP/USD turned positive for the first time in five days on Thursday, having bounced once again to near 1.2780 region on the US dollar’s retreat across its main competitors.
The improvement in the sentiment on Wall Street amid solid US New Home Sales data tempered the demand for safe-havens such as the greenback.
At the time of writing, the cable is consolidating the previous corrective bounce around 1.2750, awaiting a fresh impetus for a sustained move above 1.2780.
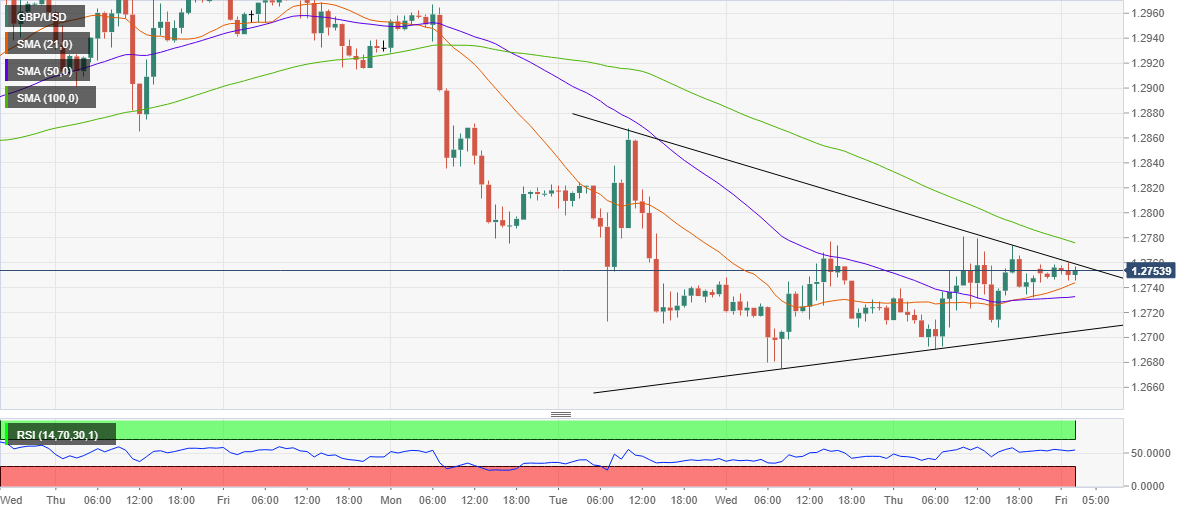
Technically, the price is ranging in a symmetrical triangle formation on the hourly chart since Tuesday.
The bulls are now eyeing to clear the falling trendline resistance at 1.2769 to confirm a bullish breakout, which could add legs to the correction move higher, with the pattern target at 1.2912 on the buyers’ radars.
The bullish crossover between the 21-hourly Simple Moving Average (HMA) and 50-HMA also backs the case for the further upside while the hourly Relative Strength Index (RSI) points north above the midline.
Alternatively, the immediate downside is capped by the 21-HMA at 1.2744, below which the horizontal 50-HMA support at 1.2732 will come into play. The rising trendline support at 1.2705 is the level to beat for the bears.
GBP/USD: Hourly chart
GBP/USD: Additional levels
