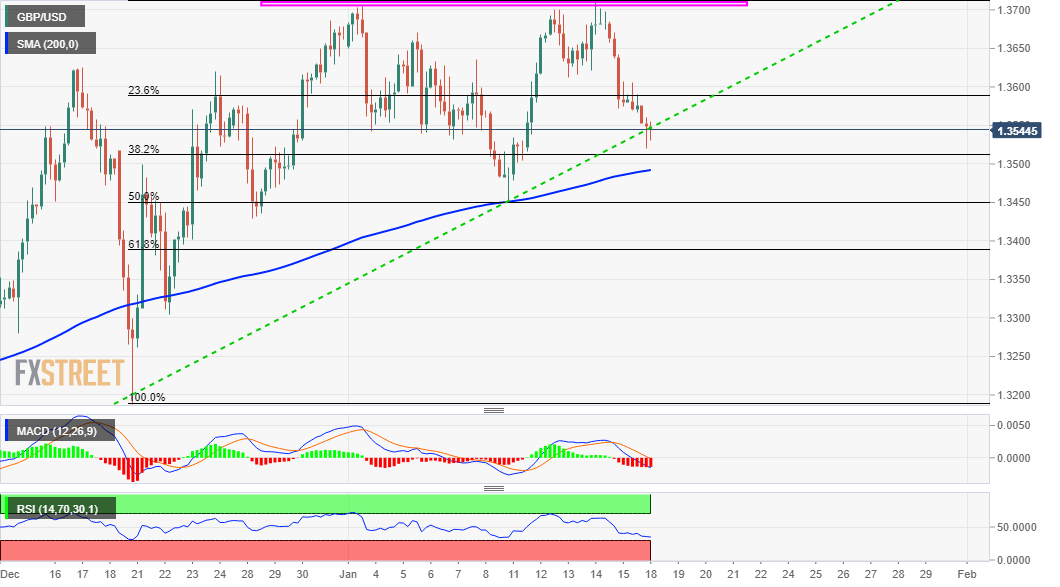
- GBP/USD remained under some selling pressure for the second straight session on Monday.
- Repeated failures near the 1.3700 level constituted the formation of a bearish multiple-tops.
- A subsequent fall below an ascending trend-line might have set the stage for a further decline.
The GBP/USD pair witnessed some follow-through selling for the second consecutive session on Monday and retreated further from multi-year tops, around the 1.3700-1.3710 region set last week. Repeated failures near the mentioned supply zone constituted the formation of a bearish multiple-top pattern on short-term charts.
Meanwhile, the retracement slide extended through the mid-European session and dragged the GBP/USD pair to multi-day lows, around the 1.3520 region. This marks a bearish break below a near one-month-old ascending trend-line support and might have already set the stage for a further near-term depreciating move.
The bearish outlook is further reinforced by the fact that technical indicators have been gaining negative traction on hourly charts. That said, oscillators on the daily chart – though have been losing positive momentum – are yet to confirm the bearish bias and thus, warrant some caution for aggressive traders.
Hence, it will be prudent to wait for some follow-through selling below the 38.2% Fibonacci level of the 1.3188-1.3710 positive move before placing fresh bearish bets. A subsequent fall below the key 1.3500 psychological mark will reaffirm the negative set-up and drag the GBP/USD pair to 50% Fibo. level, around mid-1.3400s.
On the flip side, any meaningful recovery back above the mentioned trend-line support breakpoint might now be seen as a selling opportunity. This, in turn, should cap the upside for the GBP/USD pair near the 23.6% Fibo. level, or levels just ahead of the 1.3600 mark. However, a sustained strength beyond will negate the negative outlook.
GBP/USD 4-hourly chart
Technical levels to watch

