- GBP/USD trades near the monthly high after successfully breaching 100-day EMA.
- 200-day EMA, April top on the bulls’ radars during the further upside.
- A three-week-old support line restricts immediate declines.
GBP/USD bulls catch a breather around 1.2505, up 0.10% on a day, after visiting May month’s high amid the initial Asian session on Tuesday.
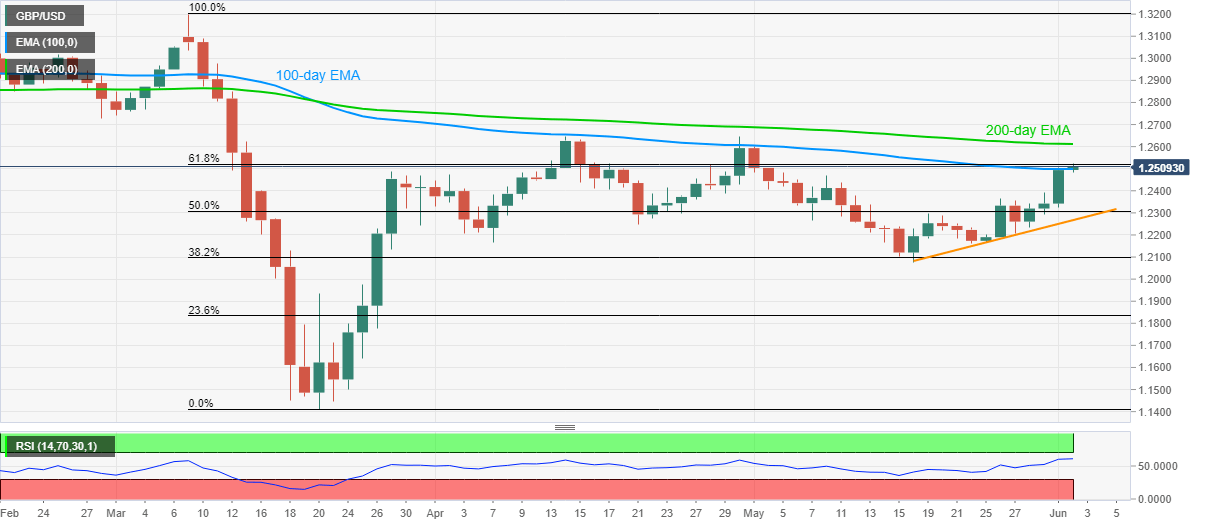
While the pair’s ability to break 100-day EMA keeps the buyers hopeful, further upside becomes less likely unless the quote crosses 61.8% Fibonacci retracement level of March month fall.
Should there be a daily closing beyond 1.2520, a 200-day EMA level around 1.2615, followed by April month top near 1.2645, could lure the bulls.
Meanwhile, a downside break below 100-day EMA level of 1.2500 could fetch the quote to Friday’s top near 1.2395.
However, the pair’s further declines will be restricted by 50% Fibonacci retracement level of 1.2308 and an ascending trend line from May 18 to around 1.2265.
GBP/USD daily chart
Trend: Bullish
