- GBP/USD trades below 100-day SMA for the first time since October 10, 2019, nears 10-week low.
- 50% Fibonacci retracement acts as the immediate support, 61.8% Fibonacci retracement and 200-day SMA could challenge bears afterward.
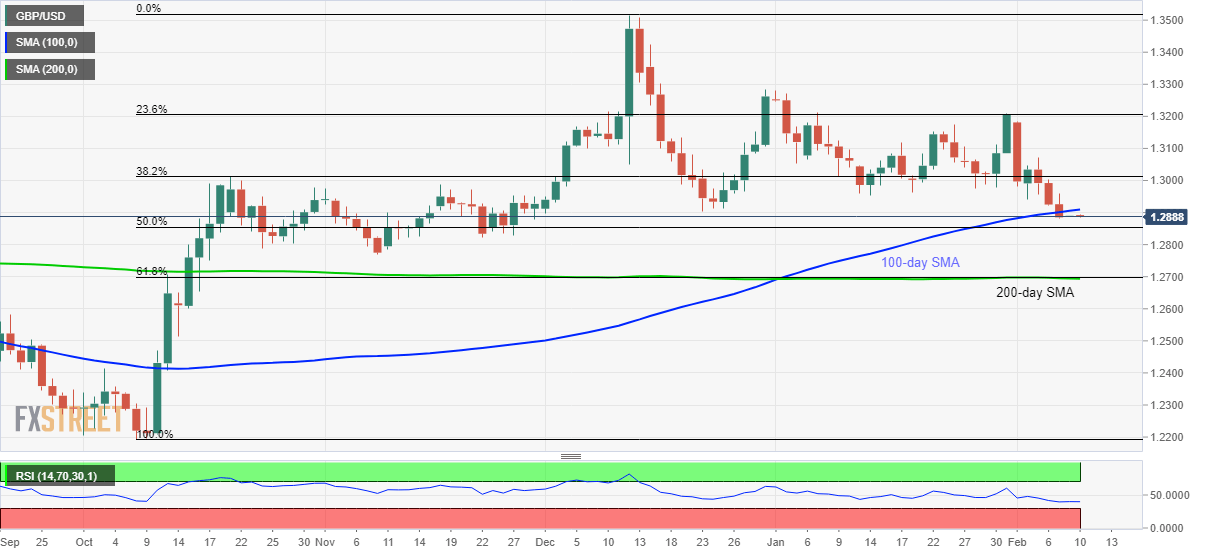
GBP/USD remains on the back foot while taking rounds to 1.2890 during the Asian session on Monday. The pair recently slipped below 100-day SMA for the first time from early-October, which in turn highlights 50% Fibonacci retracement of its October-December rise as the immediate support.
During the quote’s break below 1.2855 nearby rest-point, November 2019 low of 1.2770 can entertain the bears ahead of the key 1.2700-1.2695 support zone that includes 61.8% Fibonacci retracement and 200-day SMA.
Should there be any further weakness past-1.2695, the pair’s plunge to sub-1.2600 area can’t be ruled out.
Alternatively, a daily closing beyond 100-day SMA level of 1.2900 will have multiple nearby upside barriers around 1.2950/55 and then 1.3000.
Though, 23.6% Fibonacci retracement and December 31, 2019 high, at 1.3205 and 1.3285 respectively, will be the key resistances to watch beyond 1.3000.
GBP/USD daily chart
Trend: Bearish
