As per the prior analysis, GBP/USD Price Analysis: Under pressure between 21-day SMA and 50% Fibonacci, the pound is creeping higher, but what is the longer-term outlook?
COT, 6-months
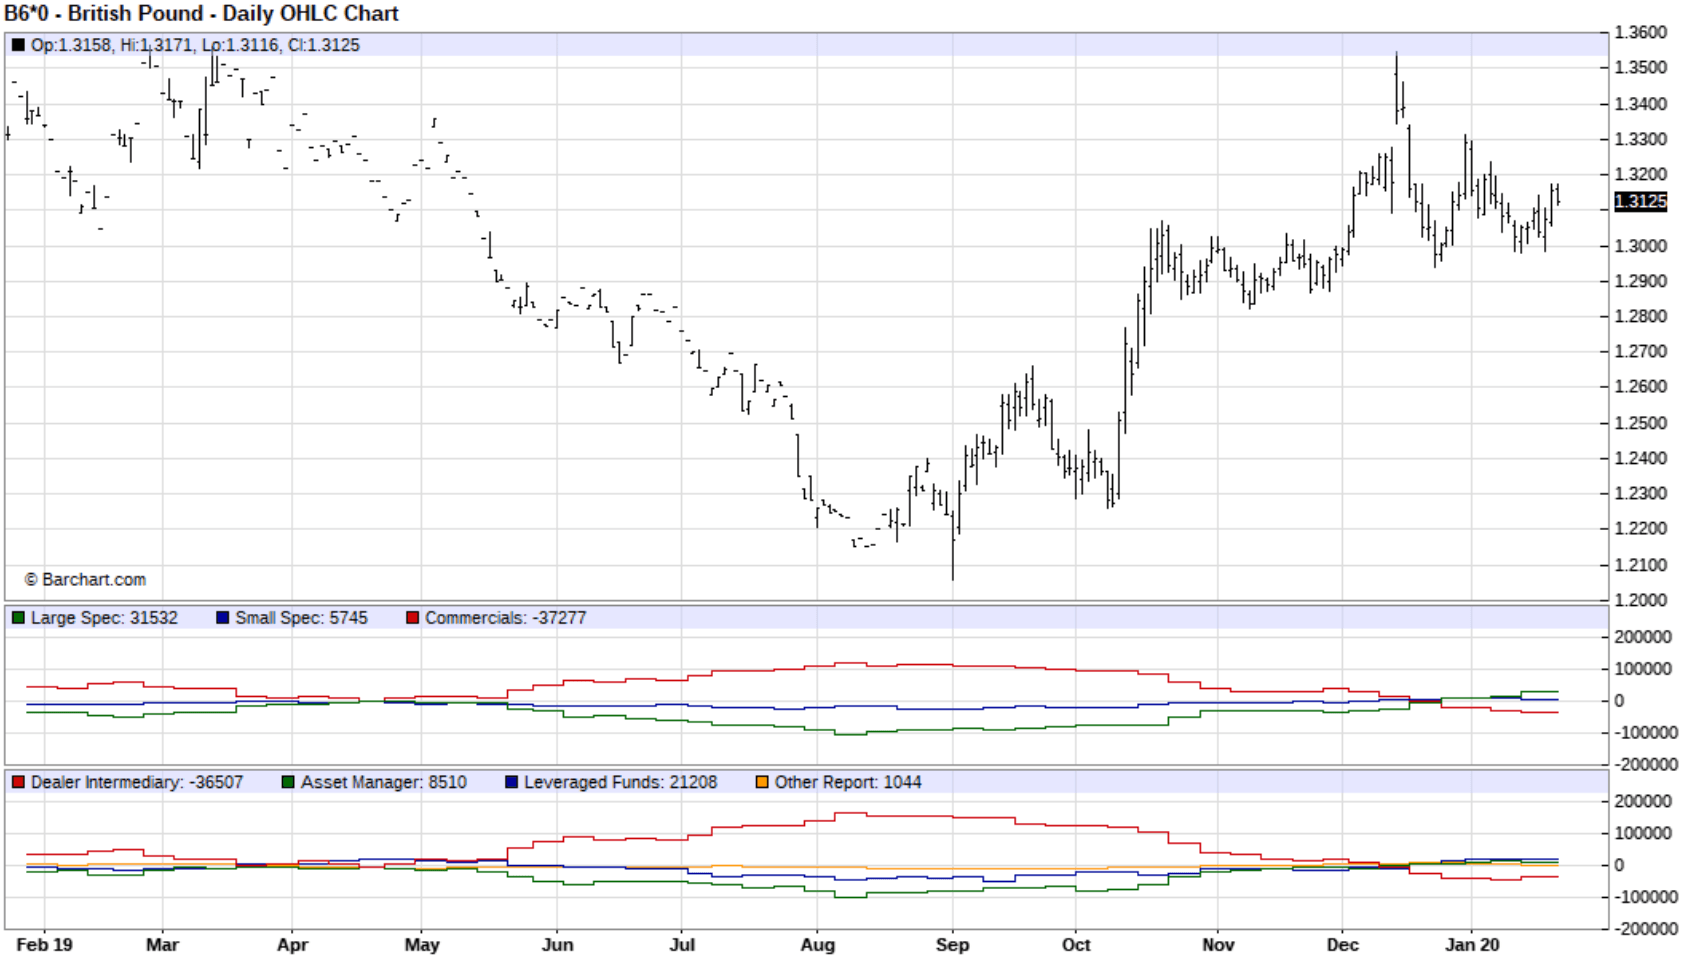
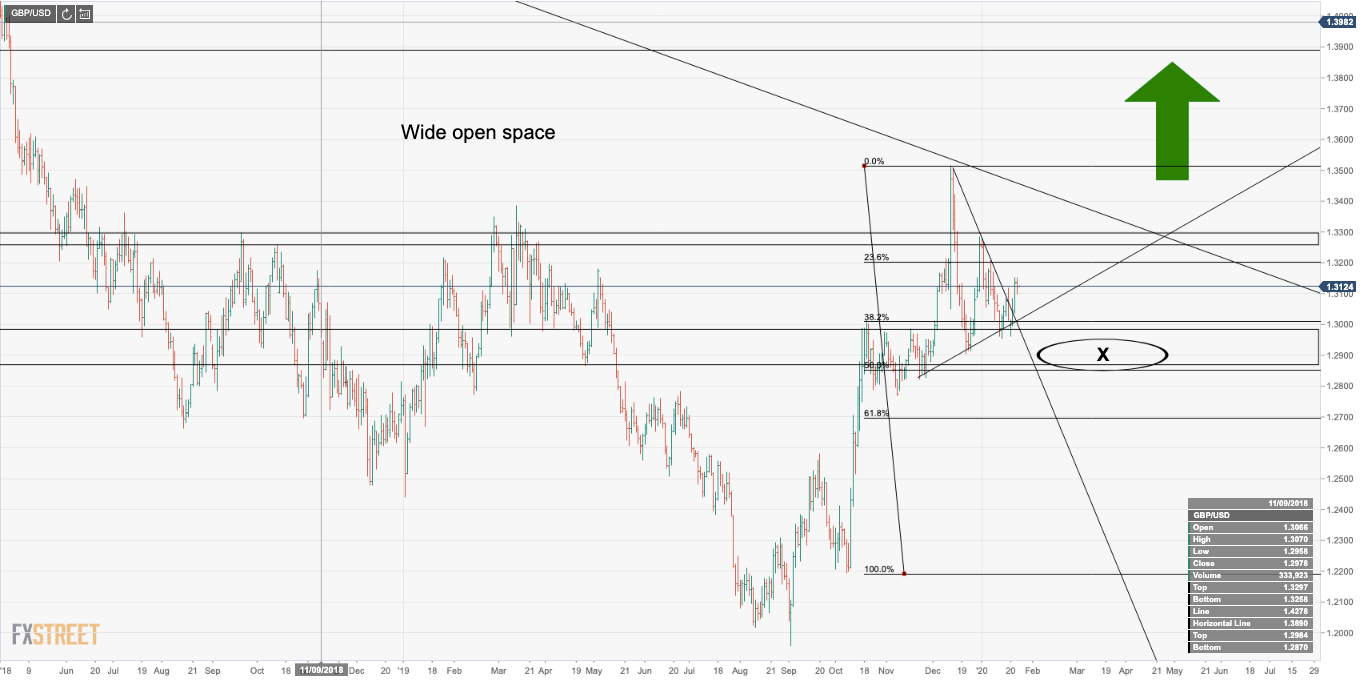
Looking to the COT report, we can see that the commercials are now short which could signal a fade on rallies and a resumption of the 2018 downtrend as large investors/speculators move to the highest long position since April 2018 and thus buyers are drying up ahead of a large open space all the way back to 1.3900. The rise in GBP net longs, (+8% of o.i.), suggests more downside risk to sterling if the Bank of England cuts rates. There need’s to be a correction before blue skies, especially should there not be a seismic meaning fundamental shock to the markets that could trigger such a move:
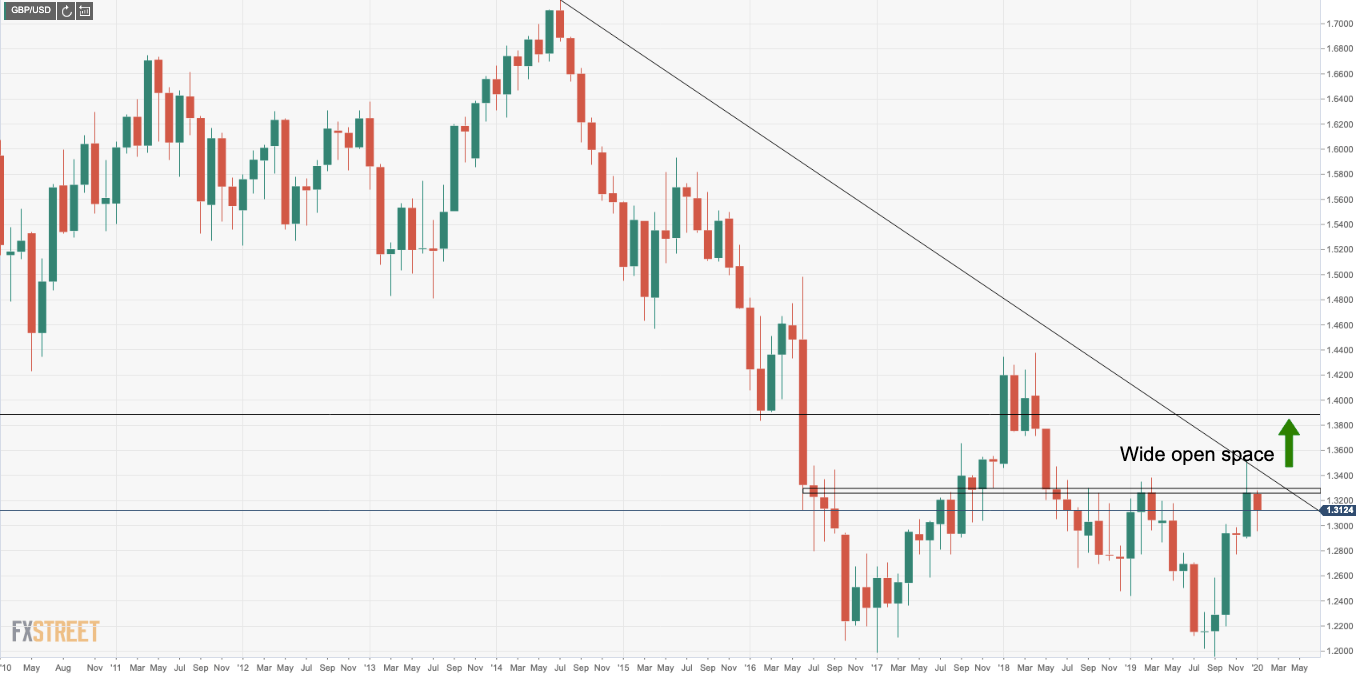
Weekly chart
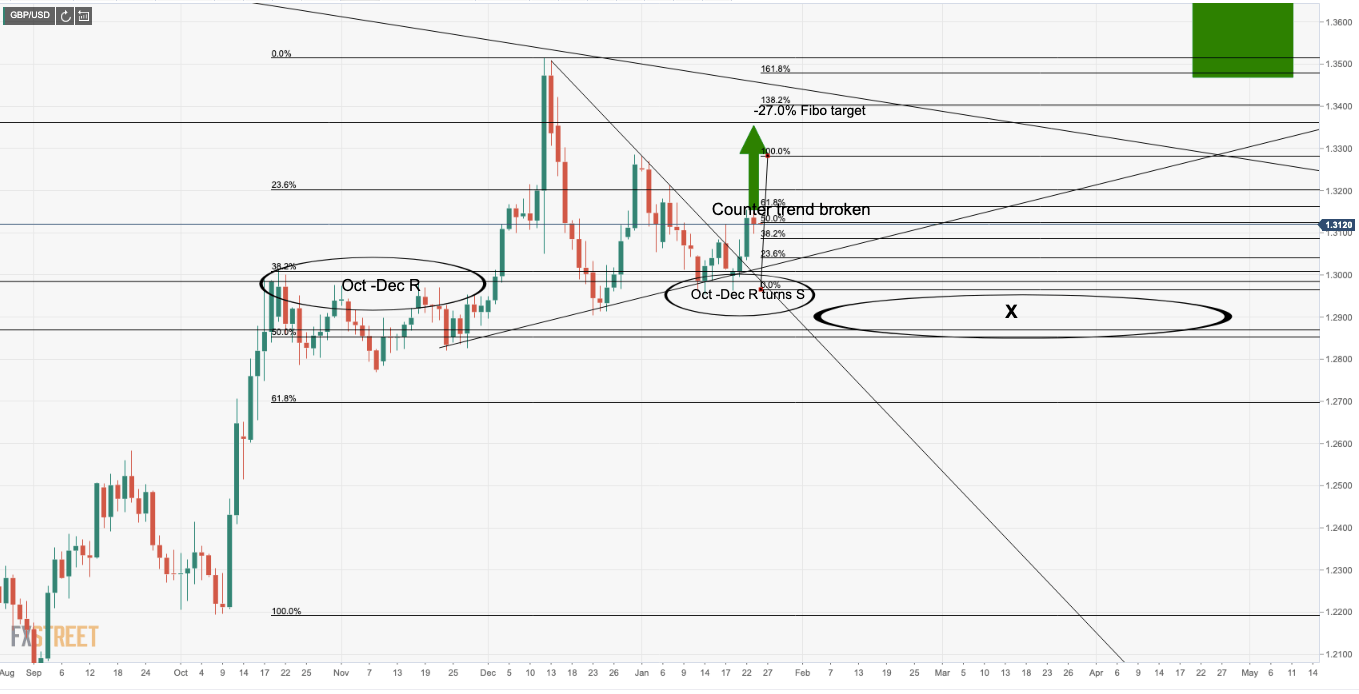
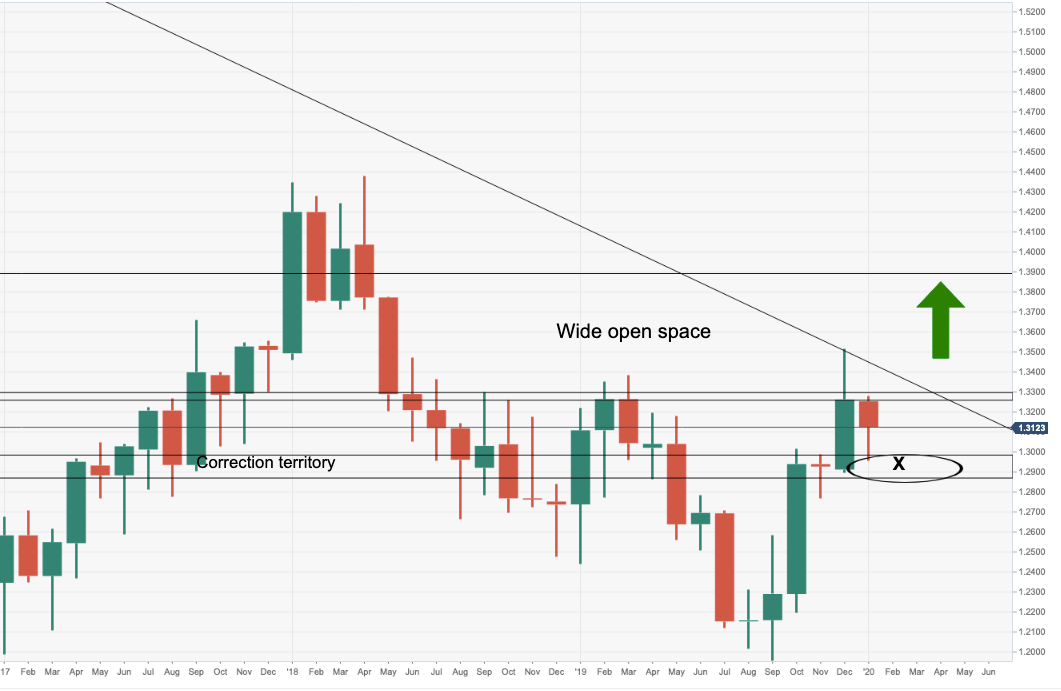
The downside correction we witnessed was the healthy reaction where X marked the spot (31.8% /50% Fibo confluence) in the 1.29 handle as follows.
Daily chart
Daily chart, bulls in control and target prior swing highs of 1.3320 as the -27.0% Fibo – (138.2% higher up at 1.3400).