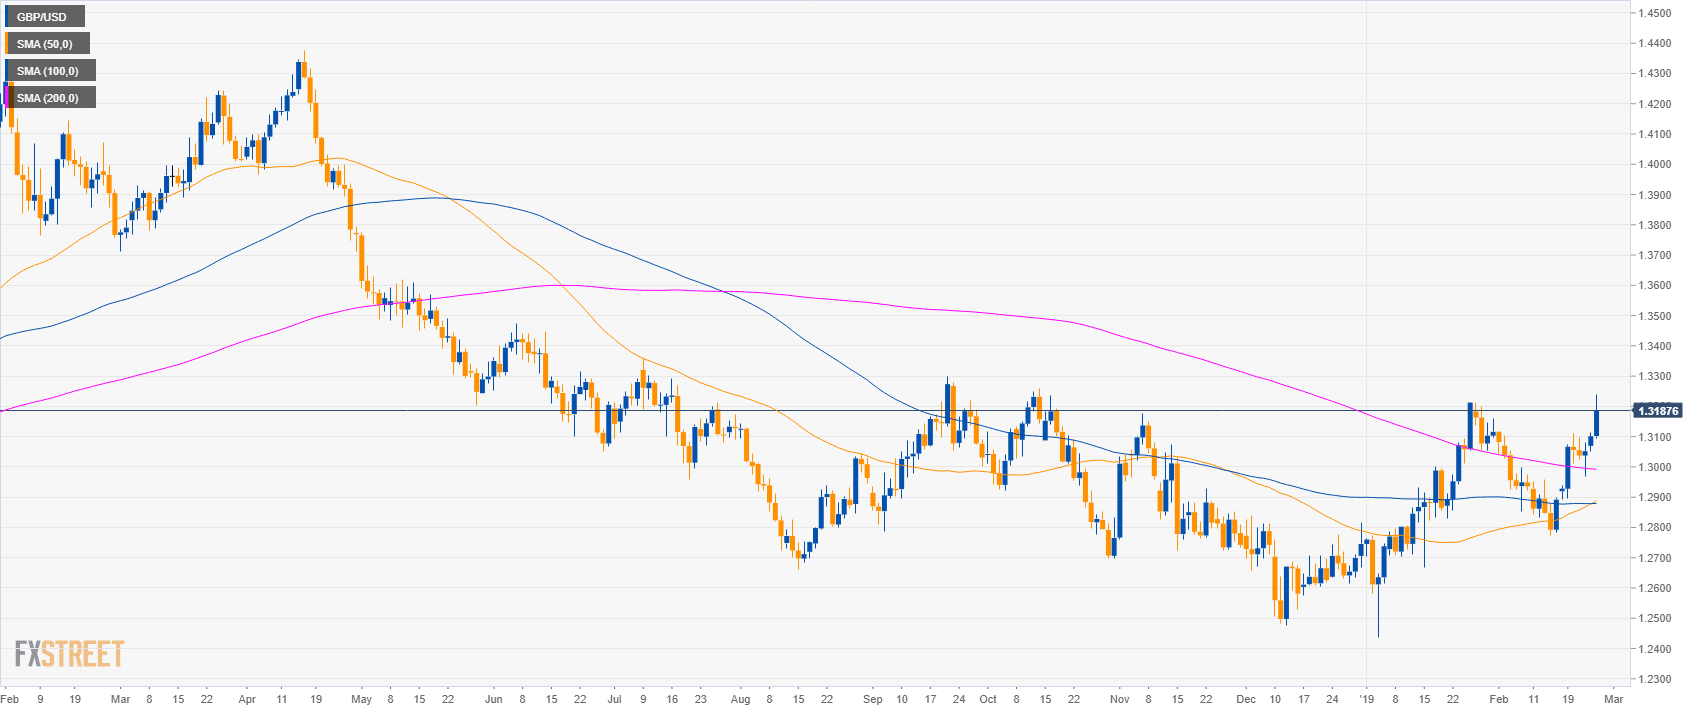
GBP/USD daily chart
- GBP/USD is trading in a bull leg above its main simple moving averages (SMAs).
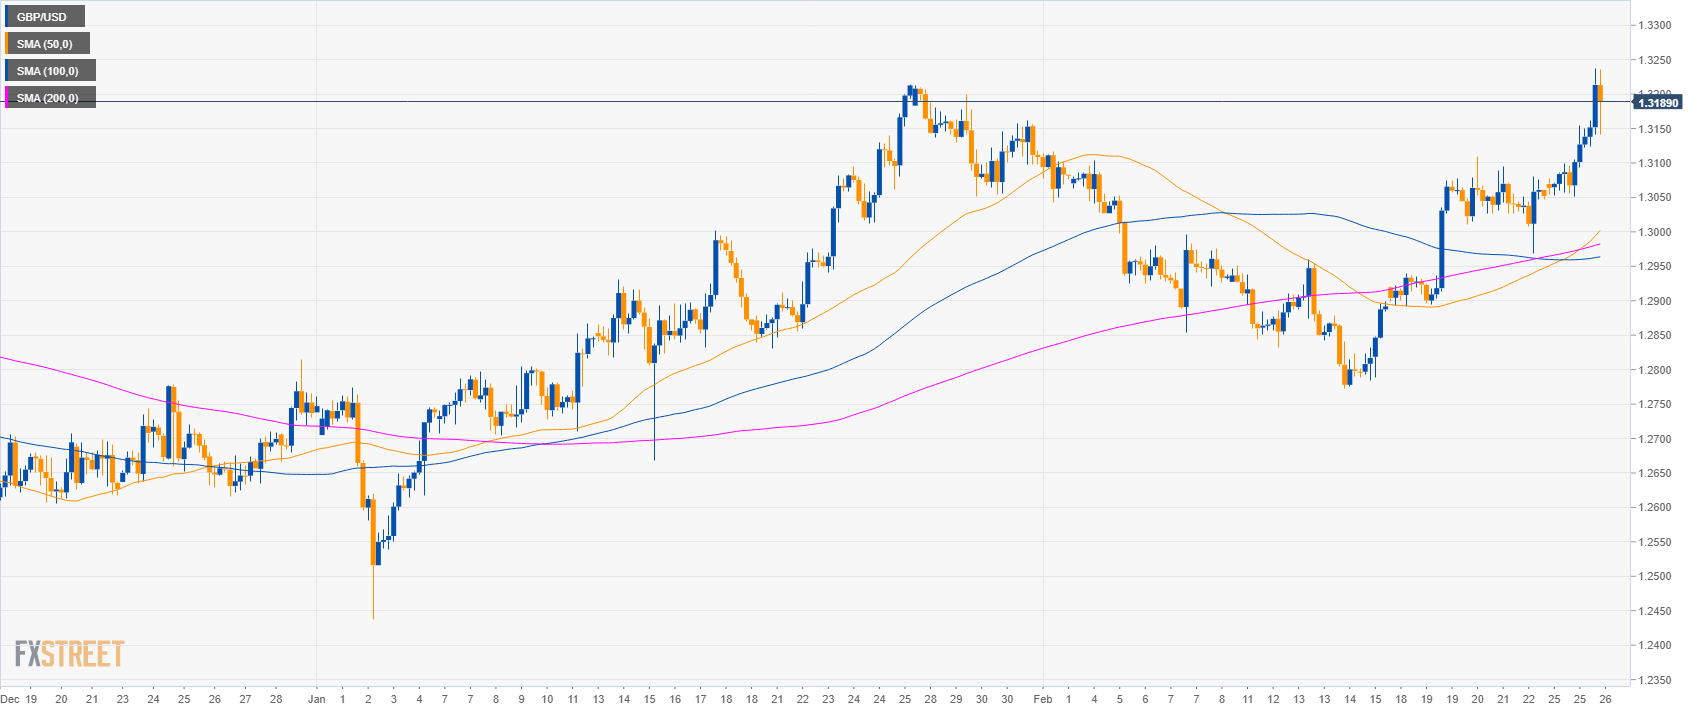
GBP/USD 4-hour chart
- GBP/USD is trading above the main SMAs suggesting bullish momentum in the medium-term.
GBP/USD 30-minute chart
- GBP/USD is trading above its main SMAs suggesting bullish momentum.
- Bulls are shooting above 1.3200 figure. A daily close above 1.3230 would lead to a run to 1.3300 figure.
- Support is at 1.3120 and 1.3060 level.

Additional key levels
GBP/USD
Overview:
Today Last Price: 1.3241
Today Daily change: 140 pips
Today Daily change %: 1.07%
Today Daily Open: 1.3101
Trends:
Daily SMA20: 1.2986
Daily SMA50: 1.2877
Daily SMA100: 1.2879
Daily SMA200: 1.2993
Levels:
Previous Daily High: 1.3115
Previous Daily Low: 1.3051
Previous Weekly High: 1.3109
Previous Weekly Low: 1.2891
Previous Monthly High: 1.3214
Previous Monthly Low: 1.2438
Daily Fibonacci 38.2%: 1.309
Daily Fibonacci 61.8%: 1.3075
Daily Pivot Point S1: 1.3063
Daily Pivot Point S2: 1.3025
Daily Pivot Point S3: 1.3
Daily Pivot Point R1: 1.3127
Daily Pivot Point R2: 1.3153
Daily Pivot Point R3: 1.3191
