- GBP/USD struggles for direction between 61.8% Fibonacci retracement and 100-bar SMA.
- Bullish MACD indicates the extension of the latest recovery to 38.2% Fibonacci retracement on the successful breakout.
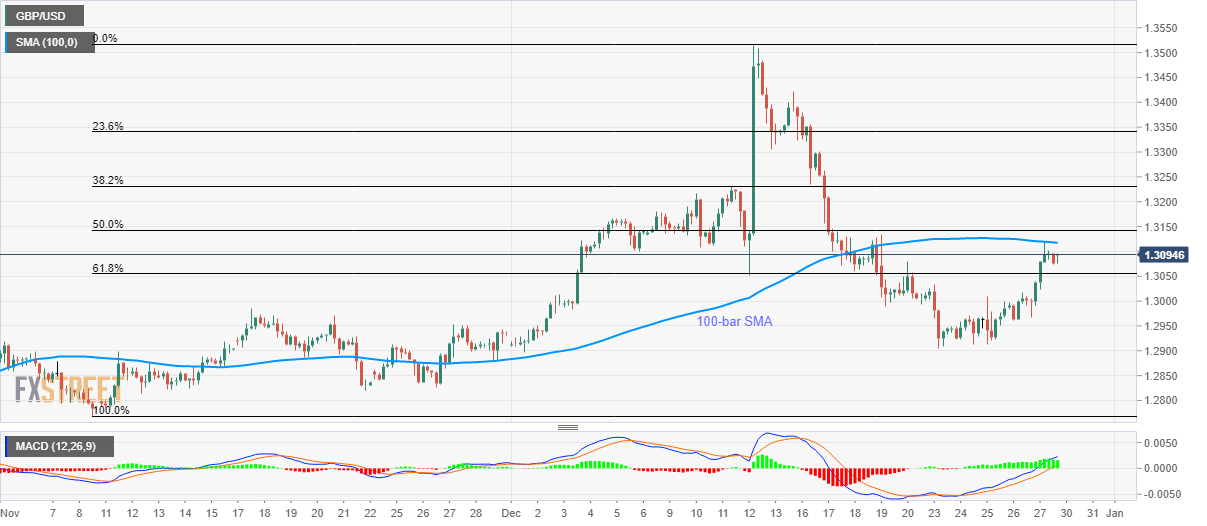
GBP/USD seesaws near 1.3090 amid the calm Asian trading session on the last Monday of 2019. Cable recently turned downwards from 100-bar Simple Moving Average (SMA). Even so, prices stay above 61.8% Fibonacci retracement of its early November-December upside.
Additionally, 12-bar Moving Average Convergence and Divergence (MACD) also increases the odds of pair’s further run-up.
In doing so, the quote needs to cross a 100-bar SMA level of 1.3117 to confront 50% and 38.2% Fibonacci retracement levels around 1.3145 and 1.3230 respectively.
Should prices manage to stay strong beyond 1.3230, 1.3300 will become the Bulls’ favorite.
On the contrary, sellers will look for entry below 61.8% Fibonacci retracement figure of 1.3055 while targeting the 1.3000 mark.
If the Bears dominate below 1.3000, last week’s low near 1.2900 will return to the charts.
GBP/USD four-hour chart
Trend: Sideways
