- Fewer moves between important levels.
- Gradually rising RSI portray strength.
Sustained trading beyond 23.6% Fibonacci retracement of latest downtick helps the GBP/USD pair to currently trading around 1.2665 while heading into the London open on Friday.
100-hour simple moving average (100-HMA) limits immediate advances at 1.2695 – 1.2700, a break of which can propel prices to 50% Fibonacci retracement of 1.2710 and then to 1.2735 including 61.8% Fibonacci retracement.
In a case where prices keep rallying above 1.2735, buyers may target 1.2800 round-figure.
On the contrary, a downside break of 1.2650, comprising 23.6% Fibonacci retracement, can drag the quote to 1.2625 and then to recent low surrounding 1.2600.
It is worth mentioning that the 14-bar relative strength index (RSI) is heading up which in turn signal strength in price momentum towards the north.
GBP/USD hourly chart
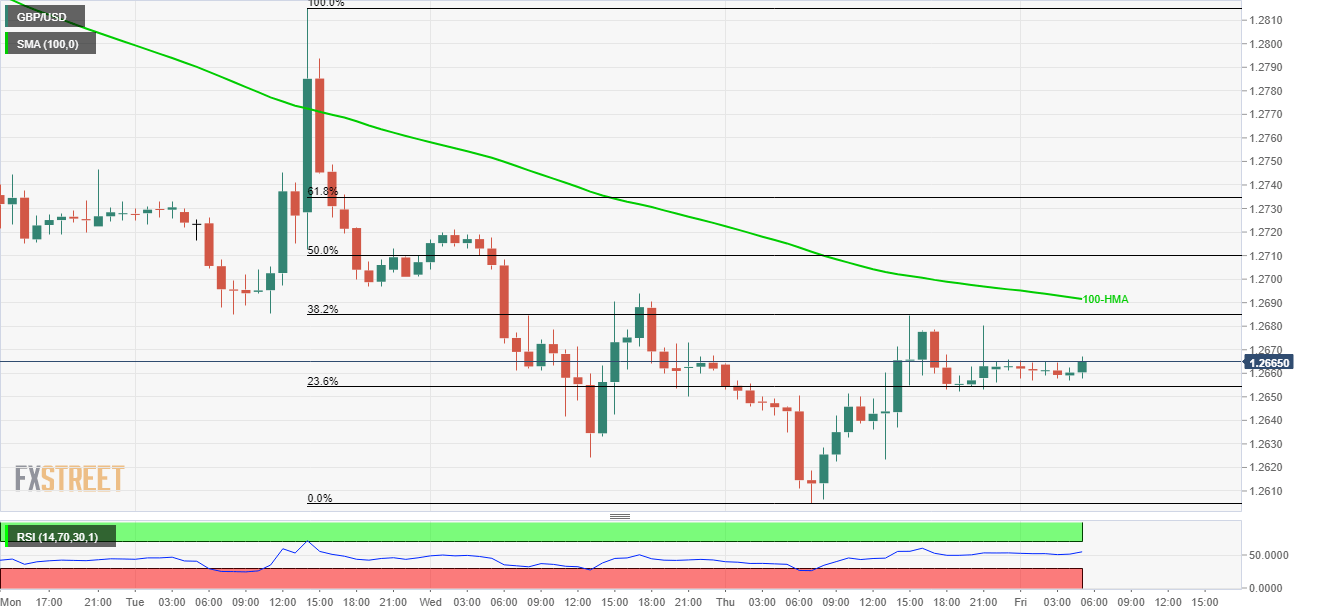
Trend: Pullback expected
