- GBP/USD stays little changed around two-month high even after clearing 100-DMA for the first time in more than four months.
- A rising trend-line since August-end, higher RSI seems to challenge buyers.
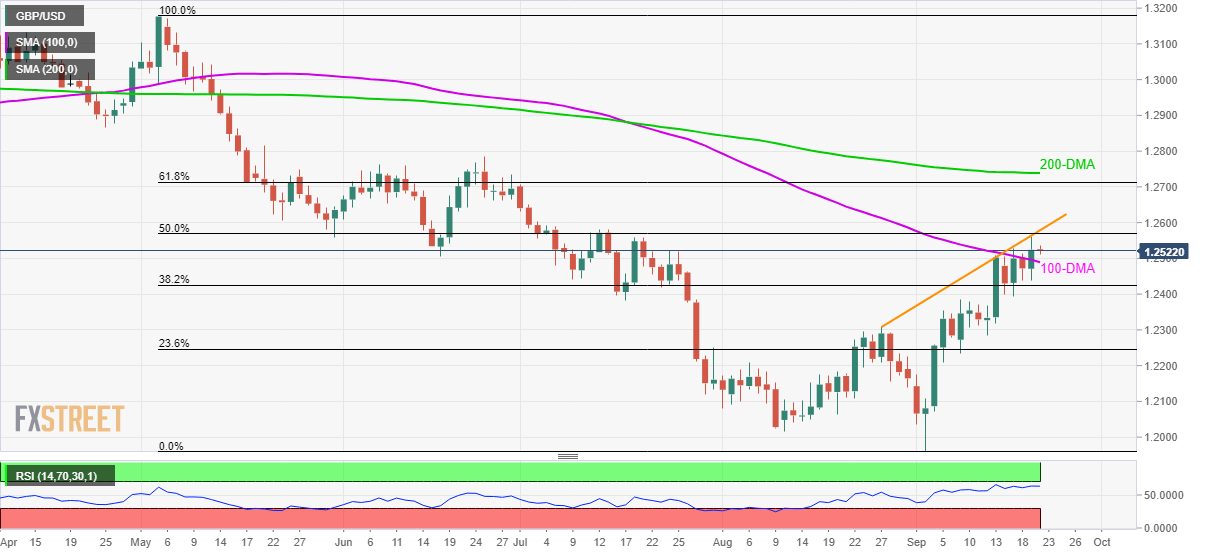
Successful trading beyond 100-day simple moving average (DMA) fails to lend much strength to the GBP/USD pair as it struggles around 1.2520 during Friday morning.
Pair’s run-up to the highest in two-months, also above 100-DMA for the first time since early-May, fails to clear a three-week-old upward sloping trend-line, close to 1.2580. Also raising challenges to buyers is the nearly overbought conditions of 14-day relative strength index (RSI).
With this, pair’s declines below 100-DMA level of 1.2490 could trigger fresh pullbacks to 1.2385/80 area including July 17 low and early-September high. However, pair’s further declines should stall around August-end tops nearing 1.2310, if not then odds of witnessing a plunge towards sub-1.2200 area can’t be denied.
Alternatively, an upside clearance of 1.2580 resistance-line can propel GBP/USD to 1.2650 and then to 61.8% Fibonacci retracement level of May-September downpour, at 1.2712.
Further, the 200-DMA level of 1.2740 could stop bulls beyond 1.2712.
GBP/USD daily chart
Trend: pullback expected
