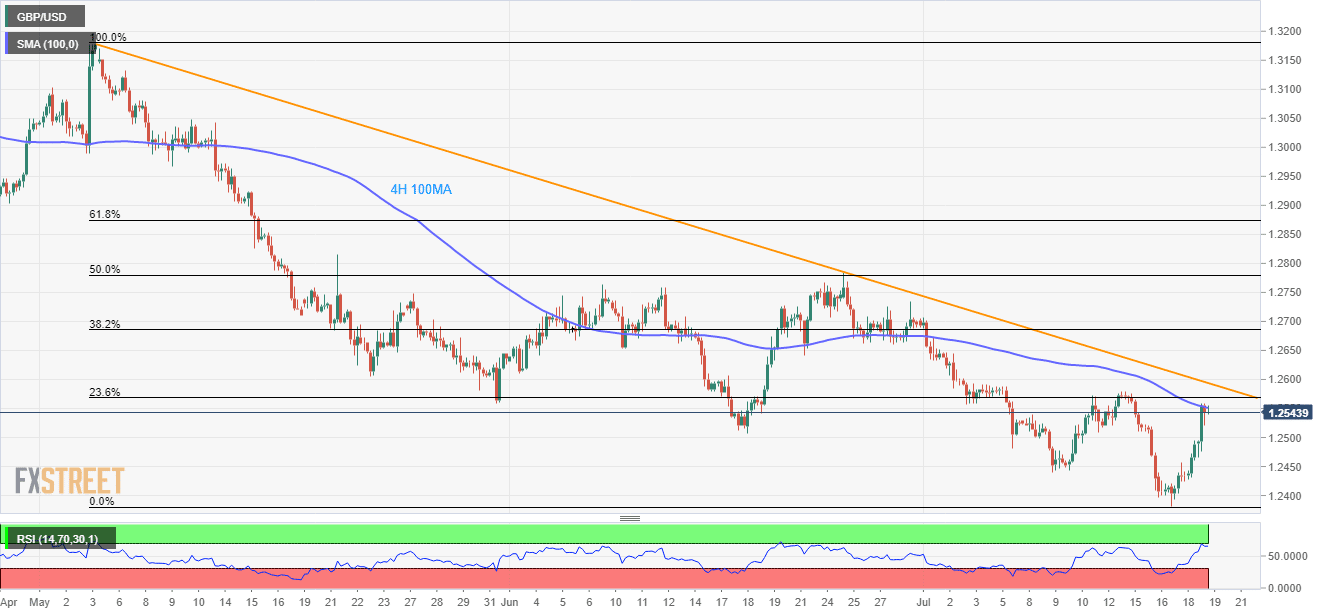
- 4H 100MA, 11-week descending trend-line limit the GBP/USD pair’s near-term upside amid overbought RSI levels.
- Sellers await a break of 1.2510/05 for fresh positions.
The GBP/USD pair’s recent recovery is currently struggling with the 100-hour moving average (4H 100MA) while taking the rounds to 1.2545 on early Friday.
Not only repeated failure to cross the key short-term moving average (MA) but overbought conditions of the 14-bar relative strength index (RSI) also signals brighter chances of the quote’s pullback to 1.2510/05 area comprising multiple supports and June month low.
In a case where sellers dominate past-1.2505, July 09 low close to 1.2440 and current month bottom surrounding 1.2382 could be on their radars.
Alternatively, pair’s ability to rise beyond 4H 100MA level of 1.2551 will be tested by the 11-week old descending trend-line ranged since early-May, at 1.2594.
However, a successful break of 1.2594 opens the gate for the rally towards late-June lows close to 1.2660.
GBP/USD 4-hour chart
Trend: Pullback expected
