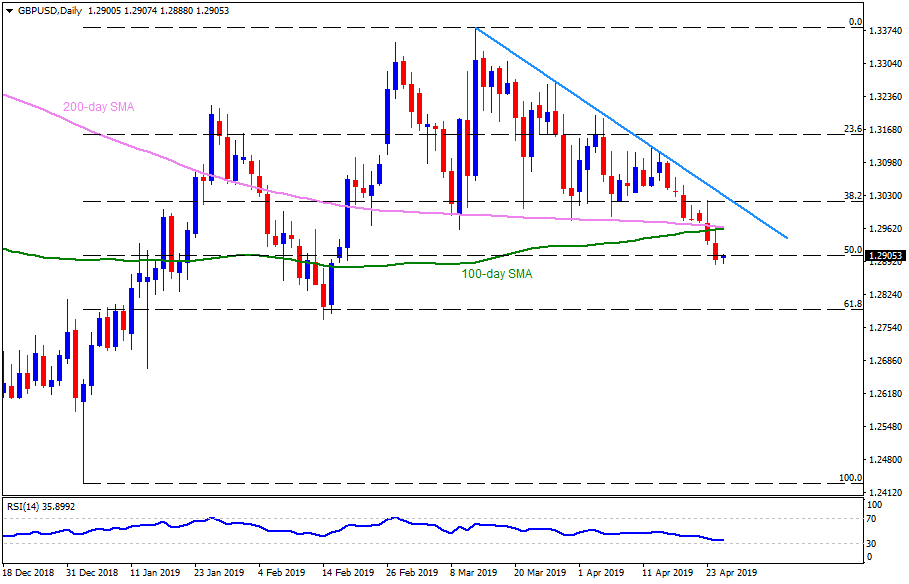
The GBP/USD pair trades near 1.2900 during early Thursday. The quote dropped to nine-week low and is struggling near 50% Fibonacci retracement of its January to March rise.
At the moment, 100-day and 200-day simple moving average (SMA) confluence region near 1.2960-65 seem nearby important resistance for the pair, a break of which can propel prices to 38.2% Fibonacci retracement near 1.3020.
Though, a downward sloping trend-line since mid-March 1.3035 may challenge buyers past-1.3020. Given the pair’s ability to cross 1.3035, chances of its rally to 1.3130 can’t be denied.
On the flipside, 1.2820 and 61.8% Fibonacci retracement near 1.2790 could offer adjacent support to the quote during further downside.
If bears refrain from respecting oversold conditions of 14-day relative strength index (RSI) and conquer 1.2790 support, 1.2710, 1.2650 and 1.2600 should become their favorites.
GBP/USD daily chart
Trend: Pullback expected
