- GBP/USD is starting to correct the selloff seen in the last weeks.
- The US Consumer Confidence at 14:00 GMT can provide some volatility on the Cable.
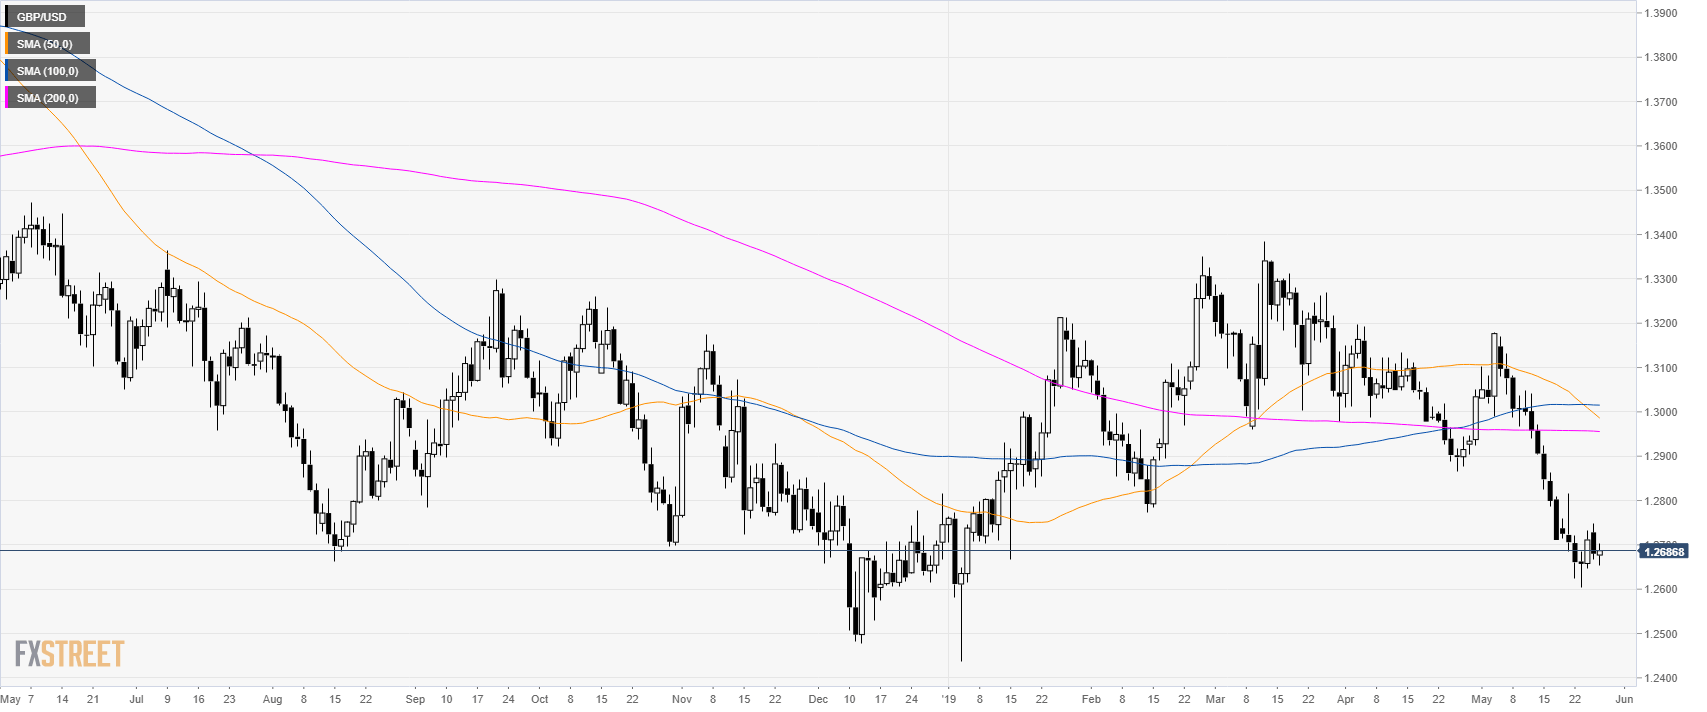
GBP/USD daily chart
In May the ongoing Brexit drama pushed the currency pair to near 1.2600 the figure.
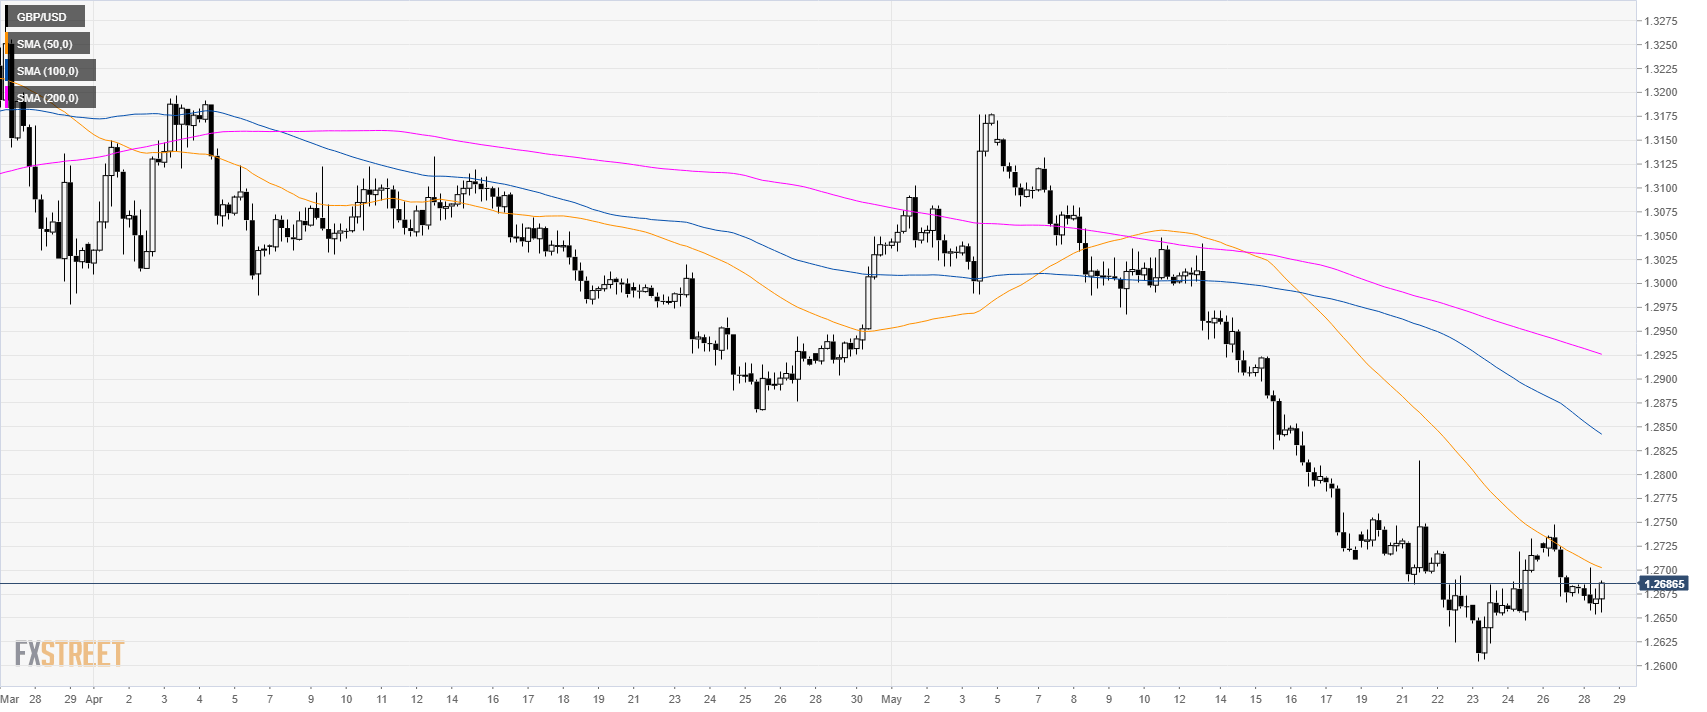
GBP/USD 4-hour chart
The market is attempting to stabilize Cable above the 1.2650 level.
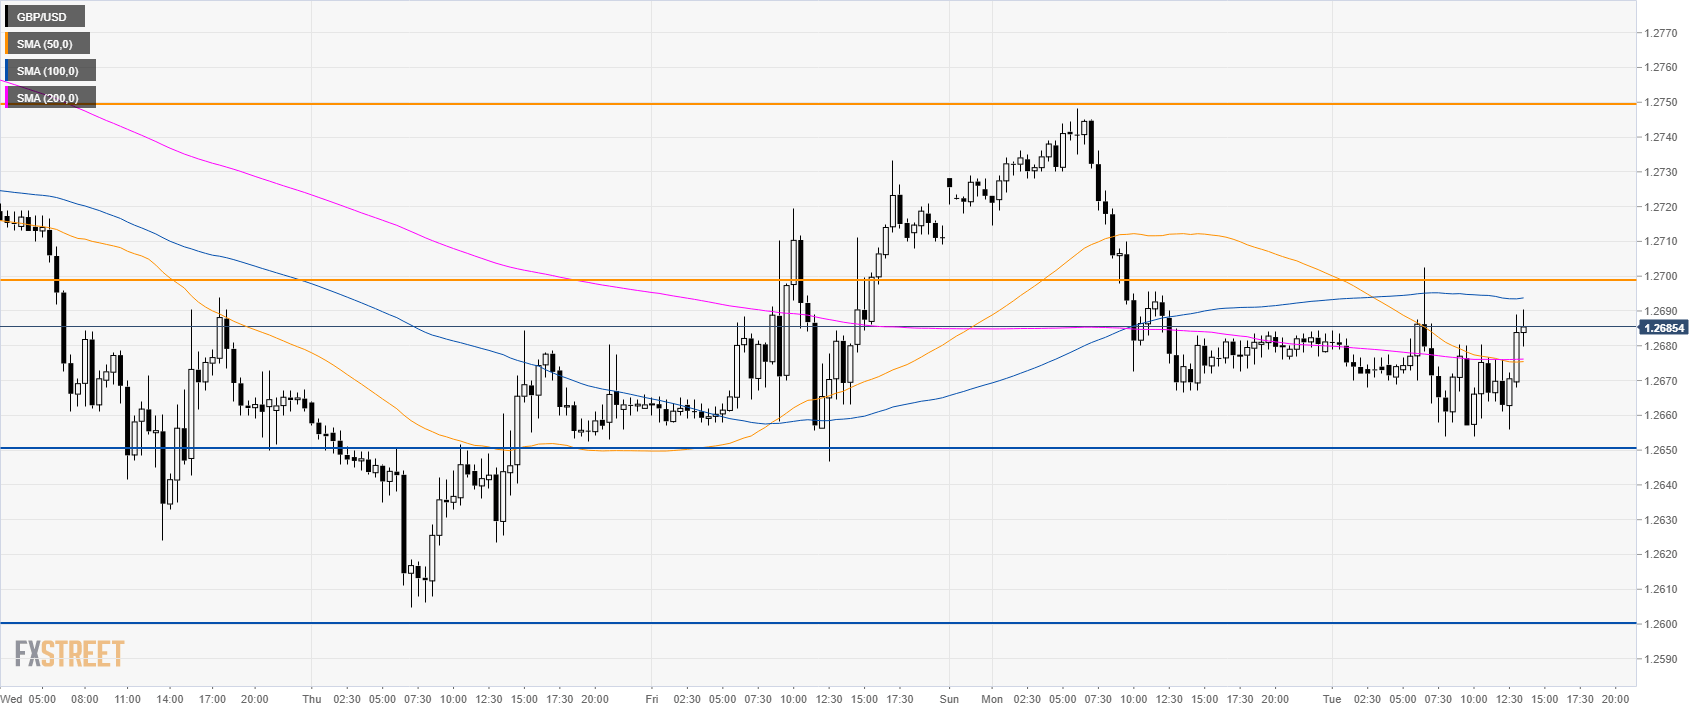
GBP/USD 30-minute chart
GBP/USD is holding above the key 1.2600 support and the 200 SMA. The market will likely try to break 1.2700 figure to reach 1.2750 to the upside. However, it is unclear if the bullls are ready for it just yet. On the flip side, a sustained break below 1.2650 can lead to 1.2600 the figure.
Additional key levels
