- Bearish candlestick formation on daily chart keeps sellers’ watch over GBP/USD despite the recent pullback.
- 21-day SMA acts as the key to a monthly low.
Bearish candlestick pattern doubts the GBP/USD pair’s latest recovery as the cable takes the bids to 1.2920 during Friday’s Asian session.
Considering the bearish pin bar on the daily (D1) chart, prices are likely to liquidate the recent upside momentum unless breaking the latest high of 1.2986. In doing so, 1.3000 and the previous month high near 1.3013 will be on the short-term buyers’ radar whereas May month top close to 1.3180 will lure the bulls afterward.
On the downside, sellers can target the 21-day Simple Moving Average (SMA) level of 1.2882 as immediate support ahead of watching over the monthly bottom surrounding 1.2770.
Should bearish signals from the 12-bar Moving Average Convergence and Divergence (MACD) stay intact past-1.2770, October 11 high close to 1.2710 will return to the charts.
GBP/USD daily chart
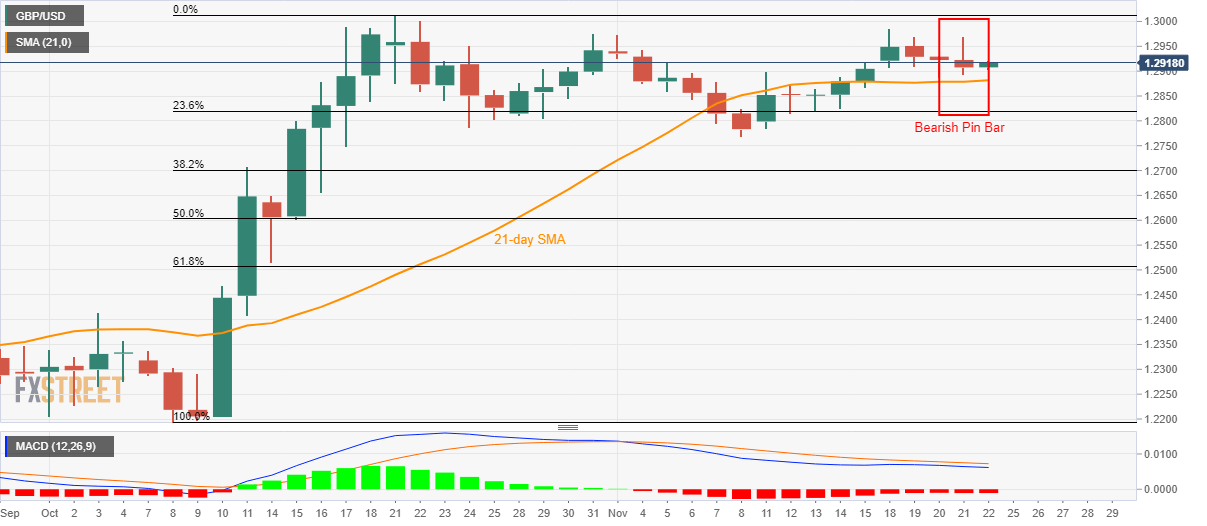
Trend: Downside expected
