- Bearish MACD joins sustained trading below the support line (now resistance).
- An upside clearance of 1.3000 becomes necessary to disappoint sellers.
Not only bearish signals from MACD and RSI but pair’s sustained trading below the short-term key trend line also portrays its weakness as it trades near 1.2865 ahead of the London open on Wednesday.
While the 12-bar Moving Average Convergence and Divergence (MACD) histogram flashes red signals, 14-bar Relative Strength Index (RSI) stays well above the oversold conditions and indicates a continuation of the present downpour.
Also adding strength to the declines is the pair’s extended weakness below one-week-old rising trend line.
With this, highs marked on October 15 and 11, around 1.2800 and 1.2700 respectively, could keep the sellers entertain ahead of challenging them with September 20 top, close to 1.2590, likely to be bears’ favorite then after.
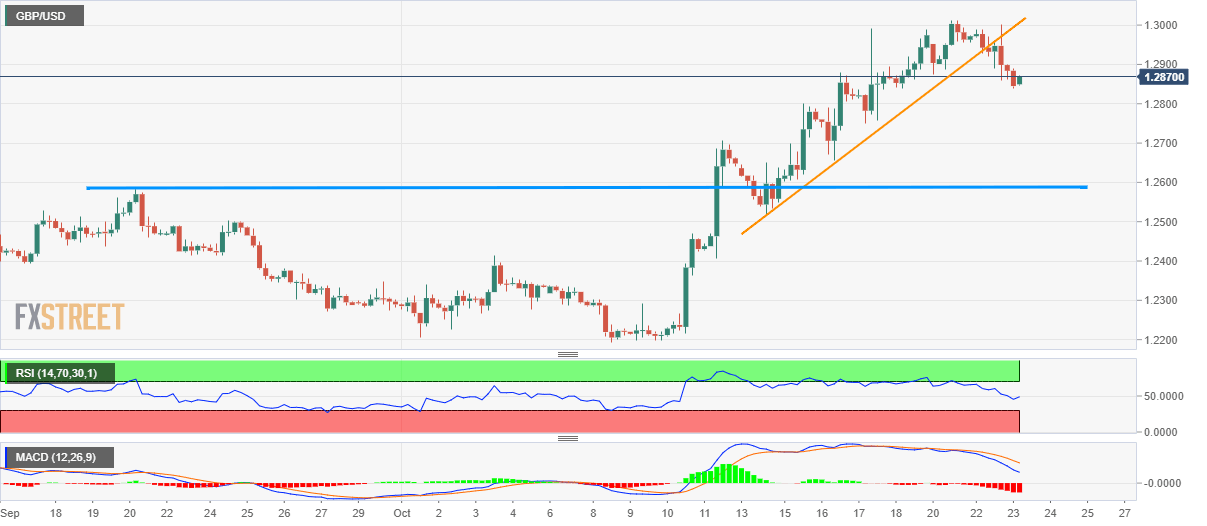
Alternatively, pair’s upside seems to have a strong resistance around 1.3000/10 area, a successful break of which becomes necessary for buyers to target May month high around 1.3180.
GBP/USD 4-hour chart
Trend: bearish
