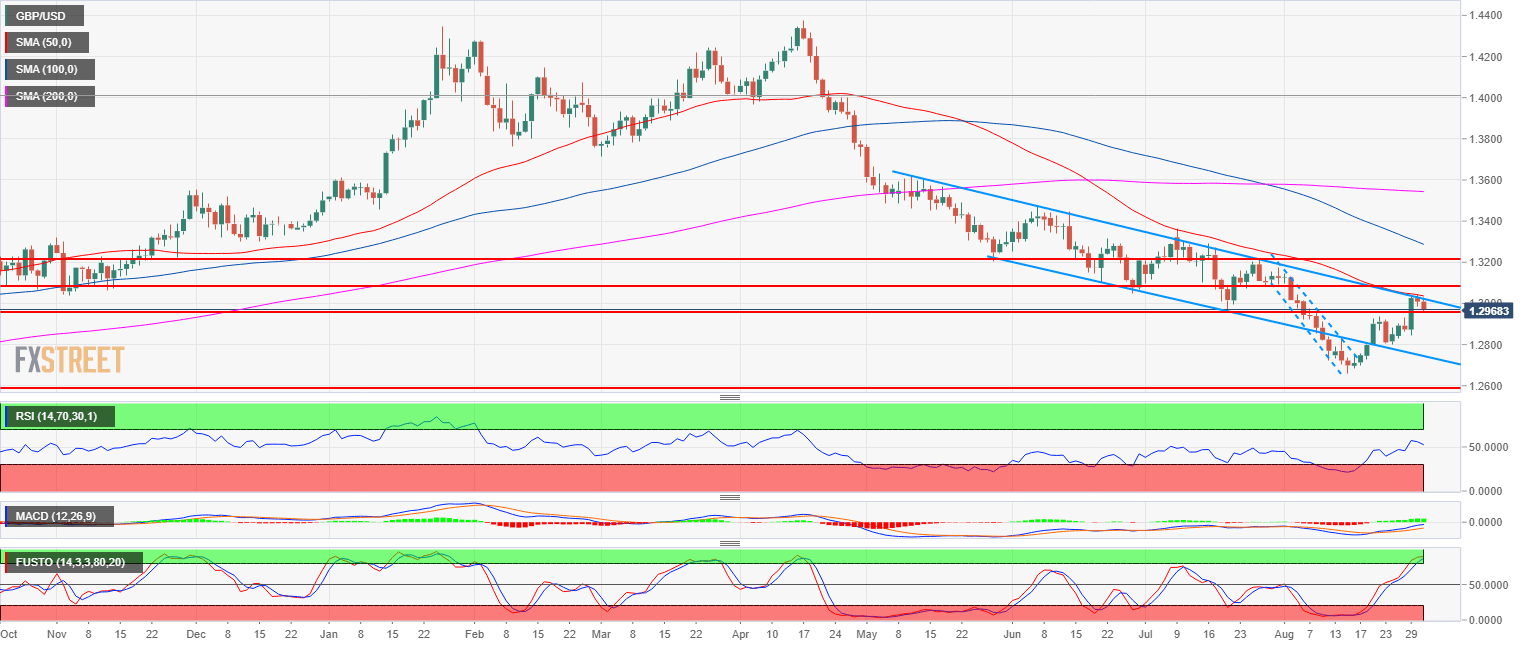
- GBP/USD main bear trend has been at risk in the last sessions.
- GBP/USD found resistance at the 50-day simple moving average, the bear trendline and the 1.3050 figure. The market is now reaching the key 1.2957 level. If bears manage to break below the support it would open the gates to the 1.2900 figure.
- A bull breakout above 1.3050 would invalidate the bearish bias.
Spot rate: 1.2970
Relative change: -0.30%
High: 1.3029
Low: 1.2960
Main trend: Bearish below 1.3050
Resistance 1: 1.3050, 50-day simple moving average, multi-month trendline
Resistance 2: 1.3082-1.3100 supply/demand level and figure
Resistance 3: 1.3214 July 26 swing high
Support 1: 1.2957 July 19 swing low
Support 2: 1.2937 August 22 swing high
Support 2: 1.2900 figure
Support 3: 1.2868 August 22 low
Support 4: 1.2838, August 10 high
Support 5: 1.2800 figure
Support 6: 1.2700-1.2723 zone, figure and August 10 low
