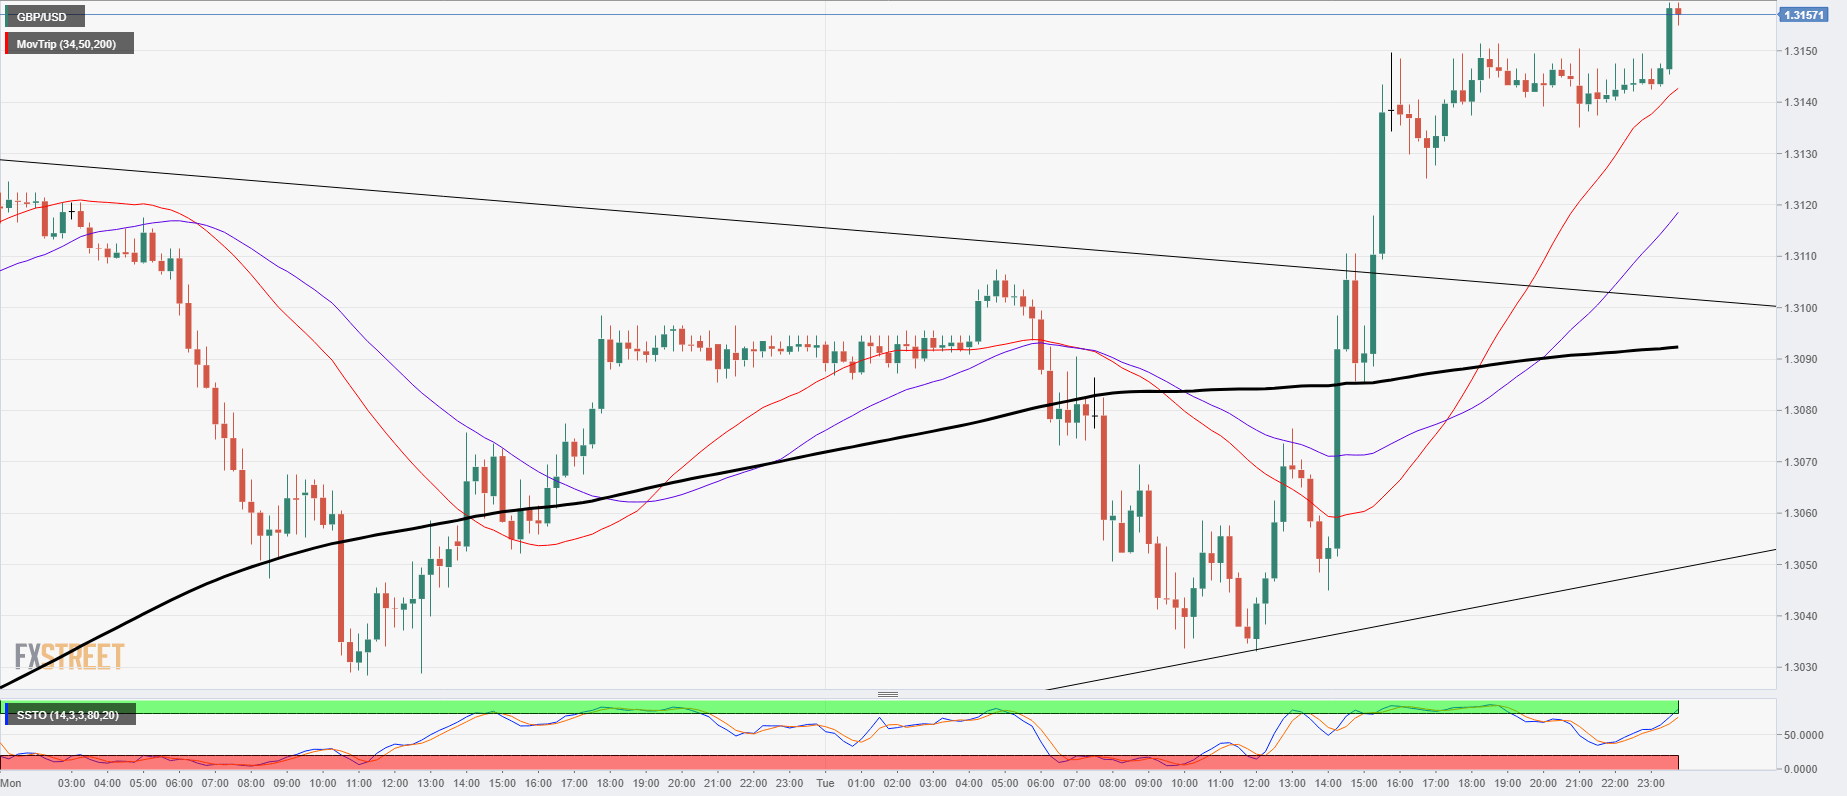
- The Sterling is in the middle of an upside break of the upper bound of a sideways triangle on higher timeframes, after rebounding off of support-turned-resistance at the 200-hour moving average near 1.3035, a confluence with the 21-day EMA.
- The pair is now testing into new highs for October, with September’s last swing high providing near-term resistance at the 1.32 technical boundary.
- Further support will likely build in from the 50-day EMA near 1.2975 if buyers fail to push the Cable back over the 1.32 barrier.
GBP/USD
Overview:
Last Price: 1.3167
Daily change: 23 pips
Daily change: 0.175%
Daily Open: 1.3144
Trends:
Daily SMA20: 1.3096
Daily SMA50: 1.2973
Daily SMA100: 1.3105
Daily SMA200: 1.3496
Levels:
Daily High: 1.3152
Daily Low: 1.3033
Weekly High: 1.3123
Weekly Low: 1.2922
Monthly High: 1.33
Monthly Low: 1.2897
Daily Fibonacci 38.2%: 1.3106
Daily Fibonacci 61.8%: 1.3078
Daily Pivot Point S1: 1.3068
Daily Pivot Point S2: 1.2991
Daily Pivot Point S3: 1.2949
Daily Pivot Point R1: 1.3186
Daily Pivot Point R2: 1.3228
Daily Pivot Point R3: 1.3305
