“¢ Despite today’s upbeat UK monthly retail sales data, the pair struggled to move past overnight swing high and has now retreated back to the 1.2700 handle.
“¢ The pair now seems to be forming an inverse head & shoulders – a bullish reversal chart pattern on the 1-hourly chart, signalling a temporary end of the recent downtrend.
“¢ The bullish formation, however, will be confirmed only once the pair decisively breaks through the neck-line hurdle near the 1.2730-35 region.
“¢ A sustained weakness back below 1.2685-80 area would invalidate the near-term positive outlook and turn the pair vulnerable to resume with its well-established bearish trajectory.
GBP/USD 1-hourly chart
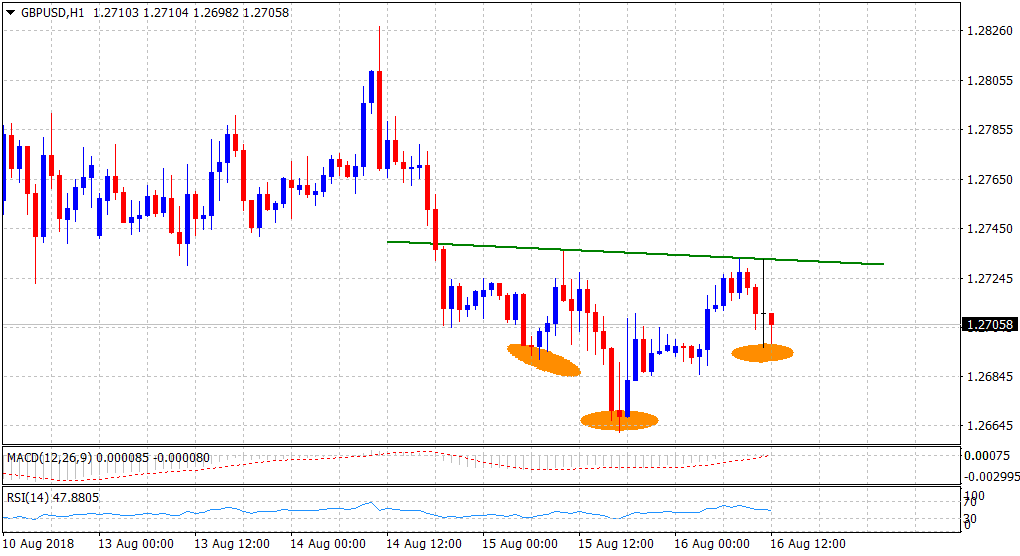
Spot Rate: 1.2706
Daily High: 1.2733
Daily Low: 1.2685
Trend: Bullish above neck-line resistance
Resistance
R1: 1.2733 (current day swing high)
R2: 1.2765 (hourly descending trend-line hurdle)
R3: 1.2800 (round figure mark)
Support
S1: 1.2685 (current day swing low)
S2: 1.2661 (over 13-month low set on Wednesday)
S3: 1.2624 (S2 daily pivot-point)
