- 100-HMA can limit bounce off 38.2% Fibonacci retracement.
- 10-day old ascending trend-line caps the downside.
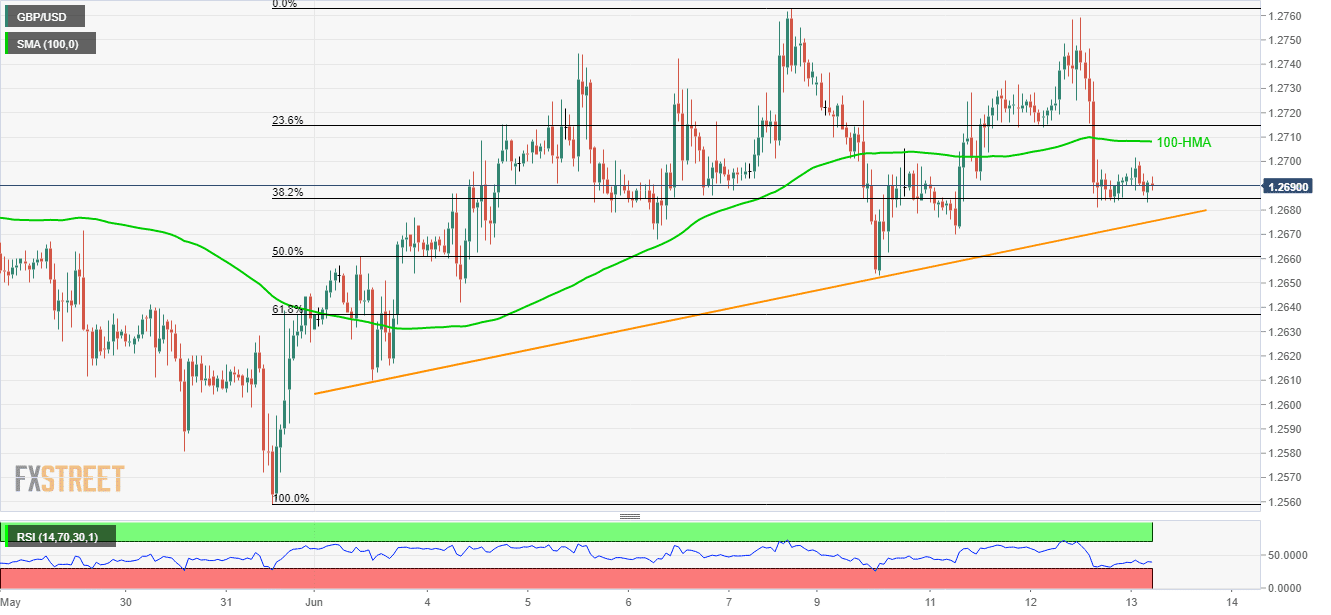
Having bounced off 38.2% Fibonacci retracement of May-end to June-start upside, the GBP/USD remains modestly flat as it trades near 1.2690 ahead of the UK open on Thursday.
While 100-hour moving average (HMA) at 1.2710 limits the pair’s immediate upside, the aforementioned trend-line figure of 1.2675 becomes the key for sellers.
Should prices respect gradually recovering 14-bar relative strength index (RSI) by crossing 1.2710 upside barrier, 1.2730 and 1.2765 are likely following number to appear on the chart.
Alternatively, a downside break of 1.2675 can drag the pair to 1.2650 and then to 1.2610.
In a case where bears refrain from respecting 1.2610, May-end bottom surrounding 1.2560 could become bears’ favorites.
GBP/USD hourly chart
Trend: Sideways
