- GBP/USD is starting the week by extending last week’s gains.
- The level to beat for bulls is the 1.3012 resistance.
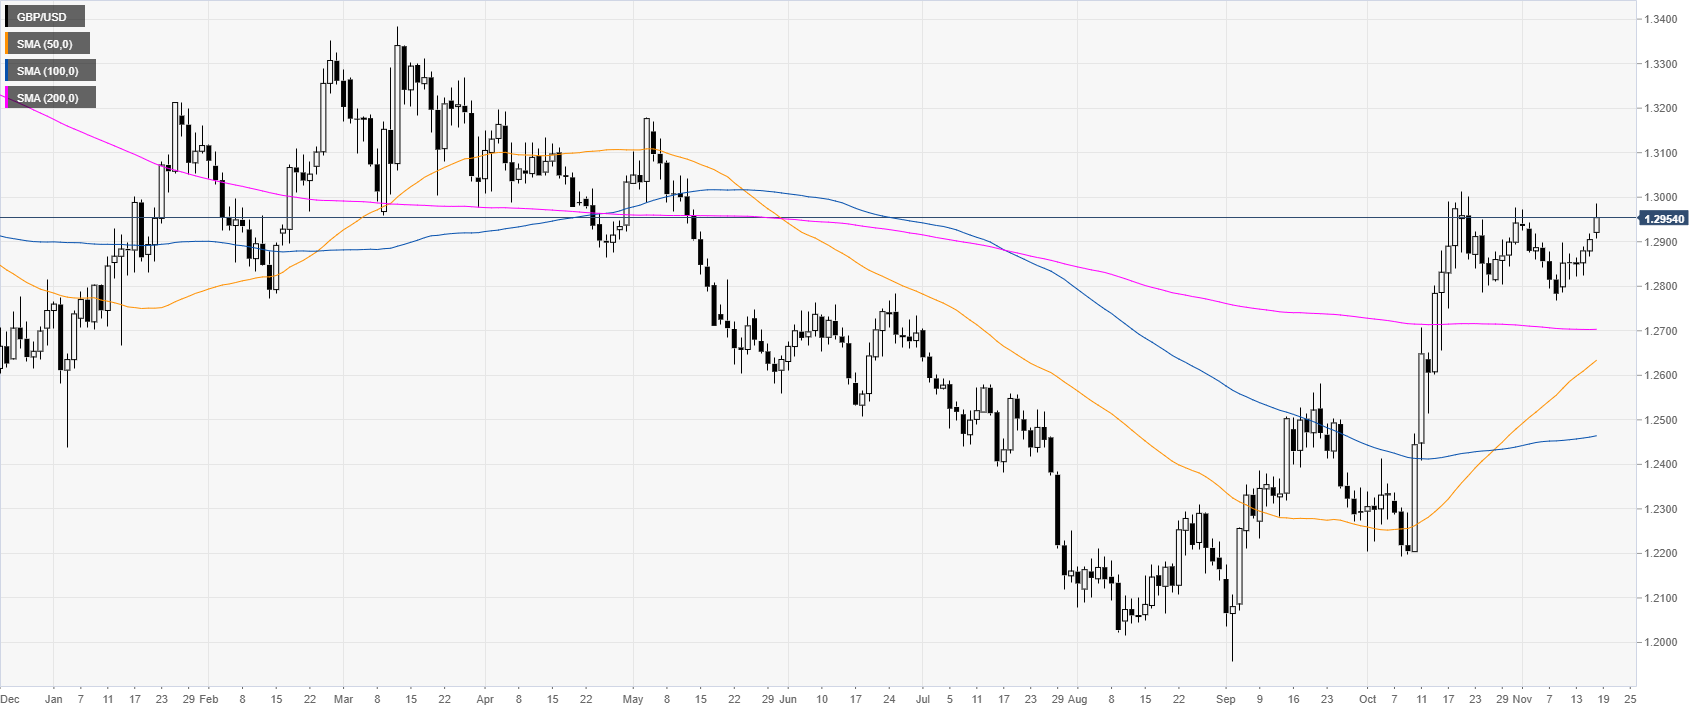
GBP/USD daily chart
The sterling is currently correcting the October’s rally in the 1.2800-1.3000 price zone. GBP/USD, last month, reached levels not seen since mid-May 2019.
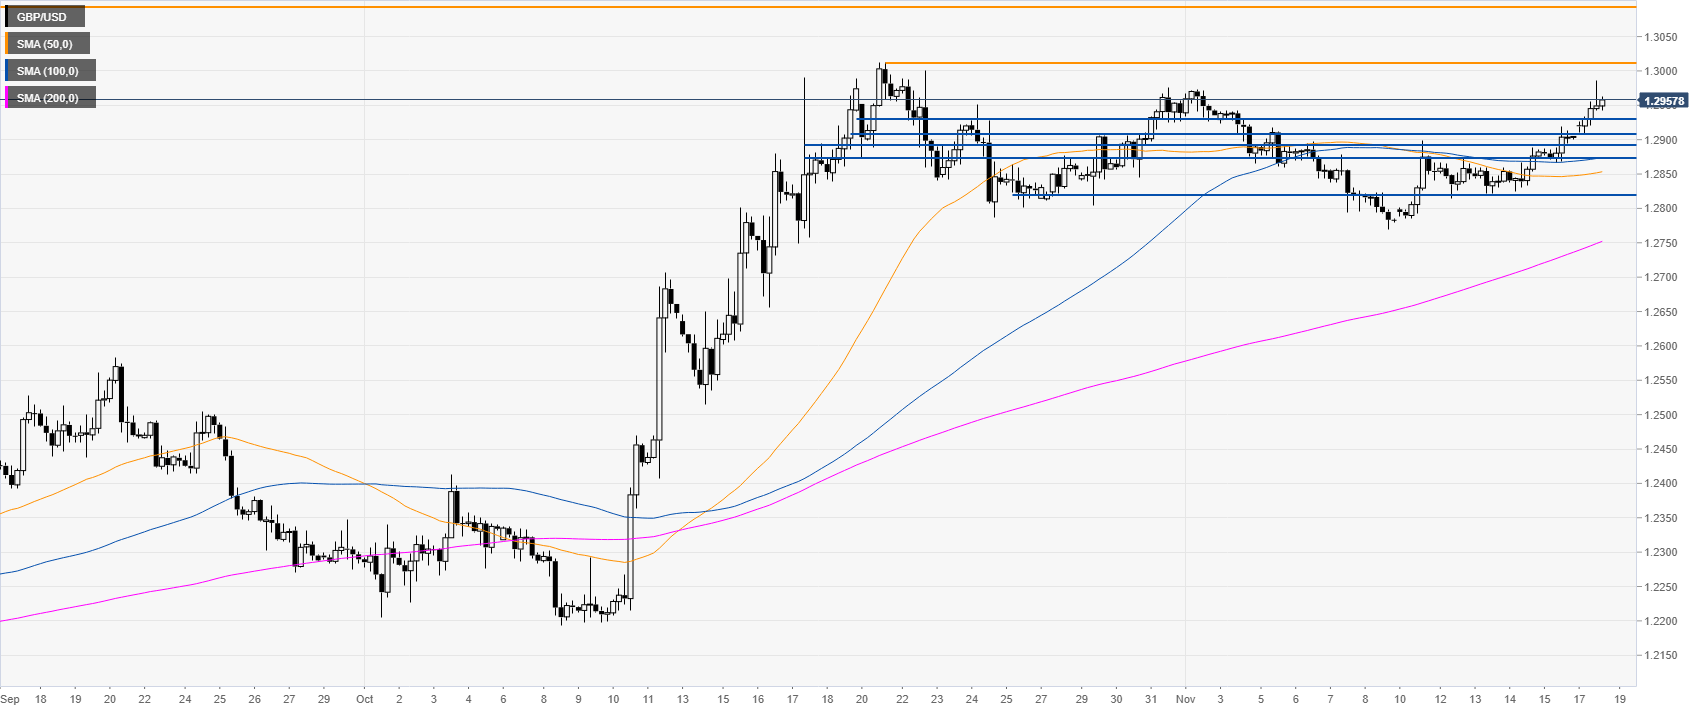
GBP/USD four-hour chart
GBP/USD hit a new monthly high this Monday as the market is grinding up toward the 1.3000 handle. The bulls are currently in control above the main simple moving averages (SMAs). However, a break above the 1.3012 resistance level seems to be necessary to confirm a potential run-up to the 1.3093 resistance, according to the Technical Confluences Indicator.
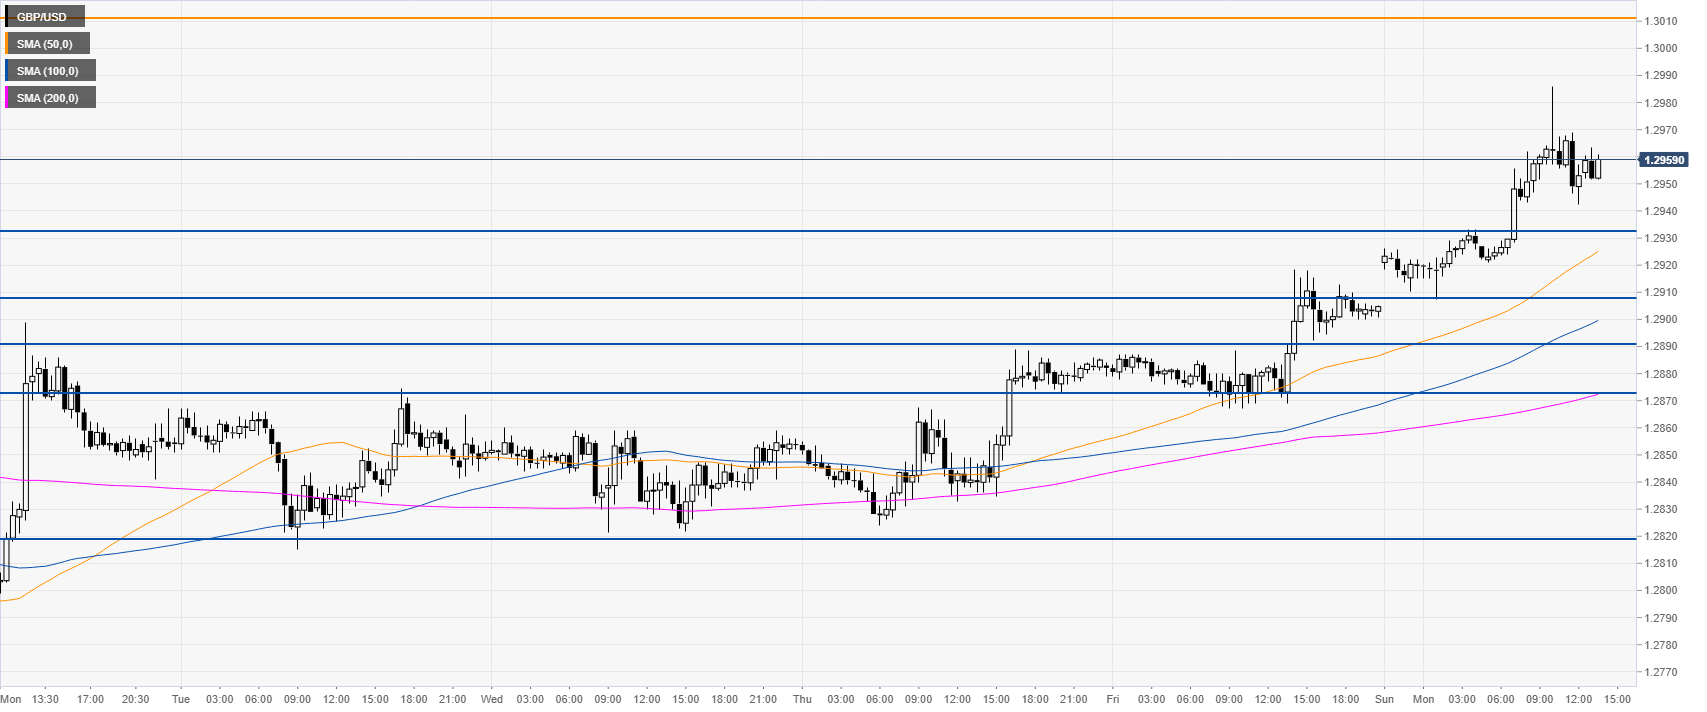
GBP/USD 30-minute chart
The spot is trading above its main SMAs, suggesting a bullish bias in the short term. There is a dense cluster of support levels awaiting in the1.2932, 1.2910, 1.2892 and 1.2870 zone, suggesting that bears might have a lot of work to do if they intend to reach 1.2824, key support, on the way down.
Additional key levels
