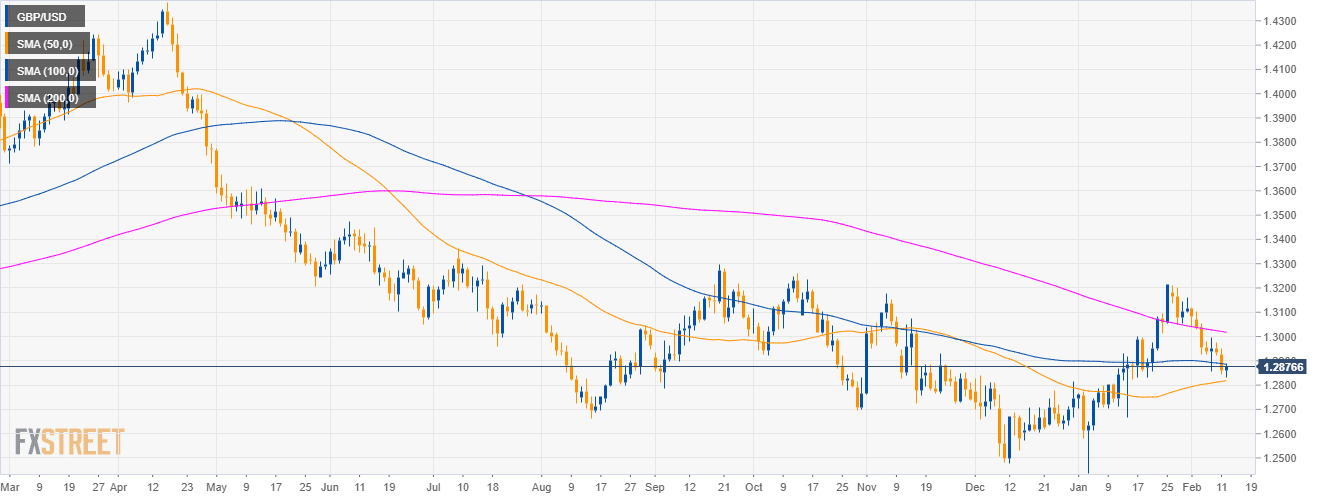
GBP/USD daily chart
- GBP/USD is trading in a bear trend below the 200-day simple moving average (SMA).
- GBP/USD is trading above the 50 SMA.
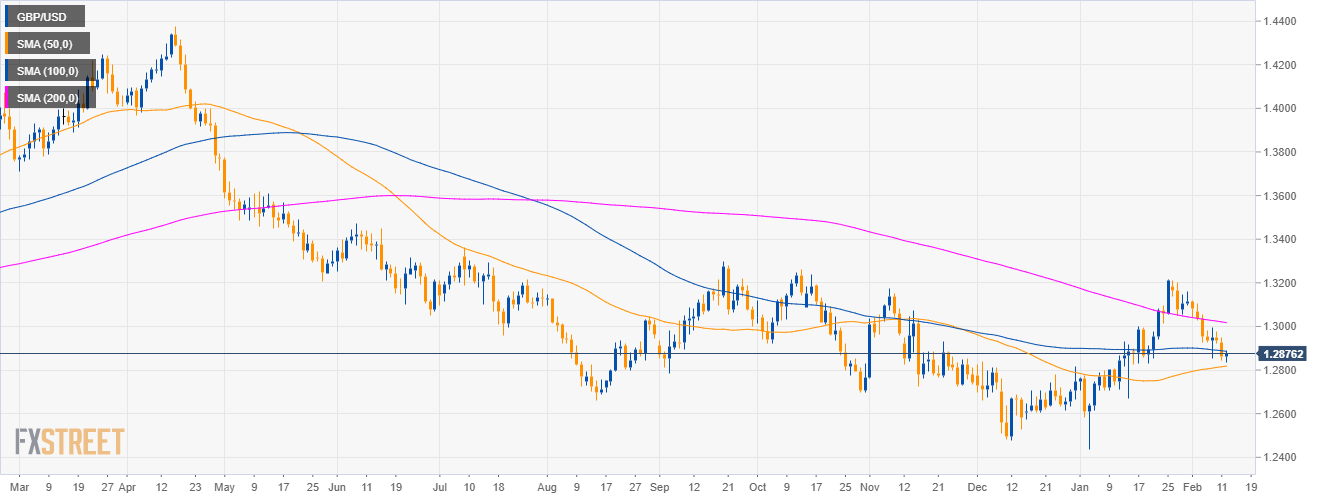
GBP/USD 4-hour chart
- GBP/USD is trading below its main SMAs suggesting bearish momentum in the medium-term.
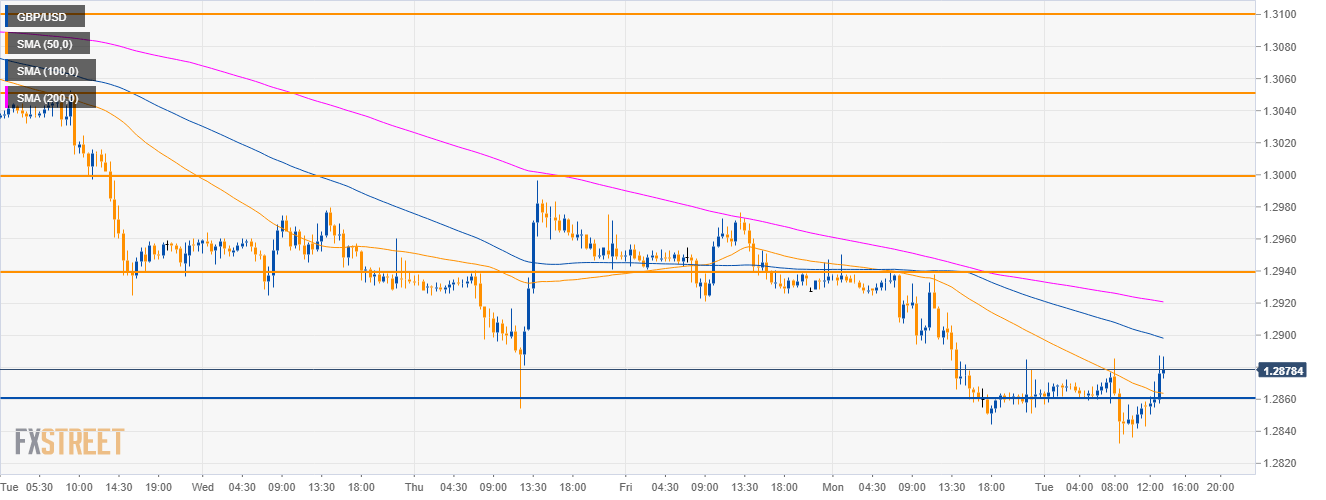
GBP/USD 30-minute chart
- GBP/USD is trading below its 200 SMA suggesting bearish momentum.
- However, bulls have retaken the 50 SMA and they might try to tarhet 1.2940 level and 1.3000 figure.
- To the downside, a breach below 1.2860 would lead to the 1.2730 level.
Additional key levels
GBP/USD
Overview:
Today Last Price: 1.288
Today Daily change: 18 pips
Today Daily change %: 0.14%
Today Daily Open: 1.2862
Trends:
Daily SMA20: 1.3001
Daily SMA50: 1.2815
Daily SMA100: 1.2888
Daily SMA200: 1.3021
Levels:
Previous Daily High: 1.295
Previous Daily Low: 1.2844
Previous Weekly High: 1.3103
Previous Weekly Low: 1.2854
Previous Monthly High: 1.3214
Previous Monthly Low: 1.2438
Daily Fibonacci 38.2%: 1.2885
Daily Fibonacci 61.8%: 1.291
Daily Pivot Point S1: 1.2821
Daily Pivot Point S2: 1.278
Daily Pivot Point S3: 1.2715
Daily Pivot Point R1: 1.2927
Daily Pivot Point R2: 1.2992
Daily Pivot Point R3: 1.3033
