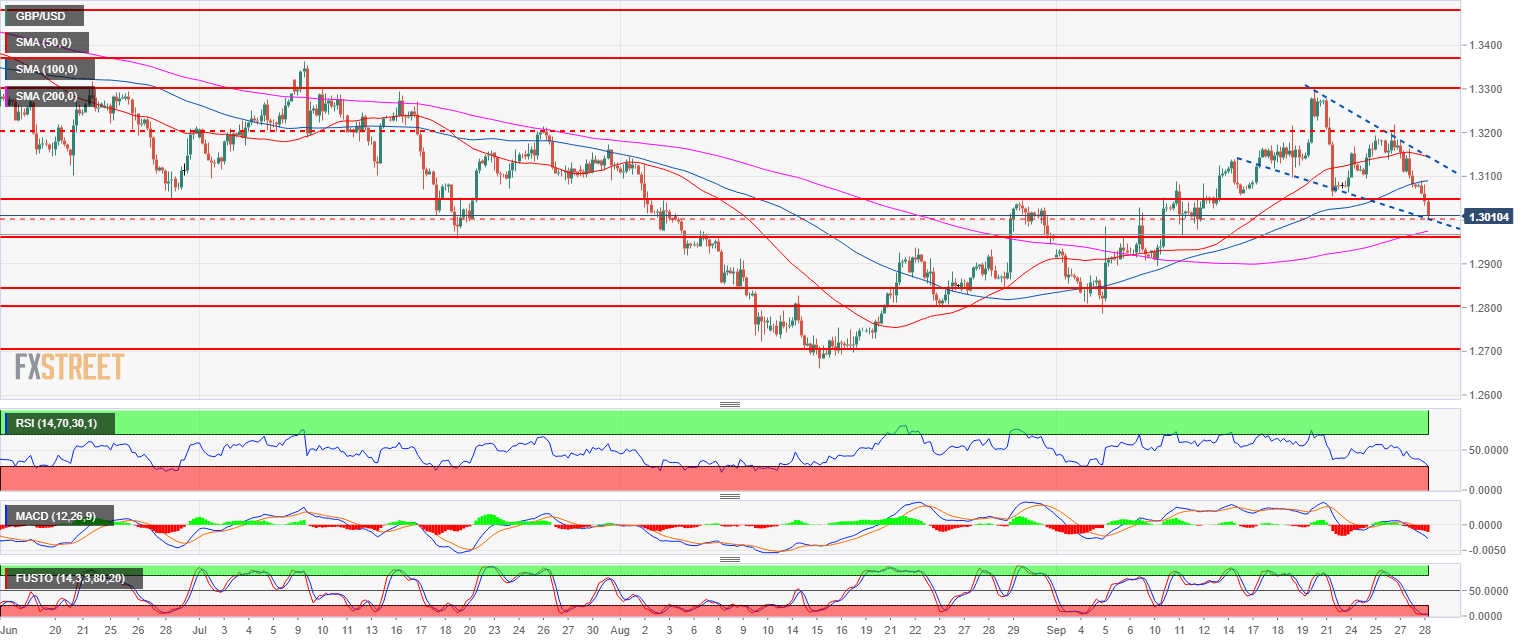
- GBP/USD bears are trying to resume the bear trend of the last months as they drove the market about 200 pips from 1.3200 to 1.3000.
- GBP/USD is in a bull flag and currently holding above 1.3000 figure. GBP/USD is trading below its 50 and 100-period simple moving average (SMA) but above its 200 SMA. The Stochastics indicator is deeply oversold while the RSI and MACD are in negative territories.
- Bulls will try to support the market above 1.3000, however, some residual bearish momentum may persist and see GBP/USD test lower levels near 1.2957 (July 19 swing low).
Spot rate: 1.3010
Relative change: -0.51%
High: 1.3091
Low: 1.3003
Main trend: Bullish
Resistance 1: 1.3050 August 30 swing high, key level
Resistance 2: 1.3100 figure
Resistance 3: 1.3144 key level
Resistance 3: 1.3200 figure (key support/resistance)
Resistance 4: 1.3300 figure
Resistance 5: 1.3363 July high
Resistance 6: 1.3472 June 7 high
Support 1: 1.3000 figure
Support 2: 1.2957 July 19 swing low
Support 3: 1.2900 figure
