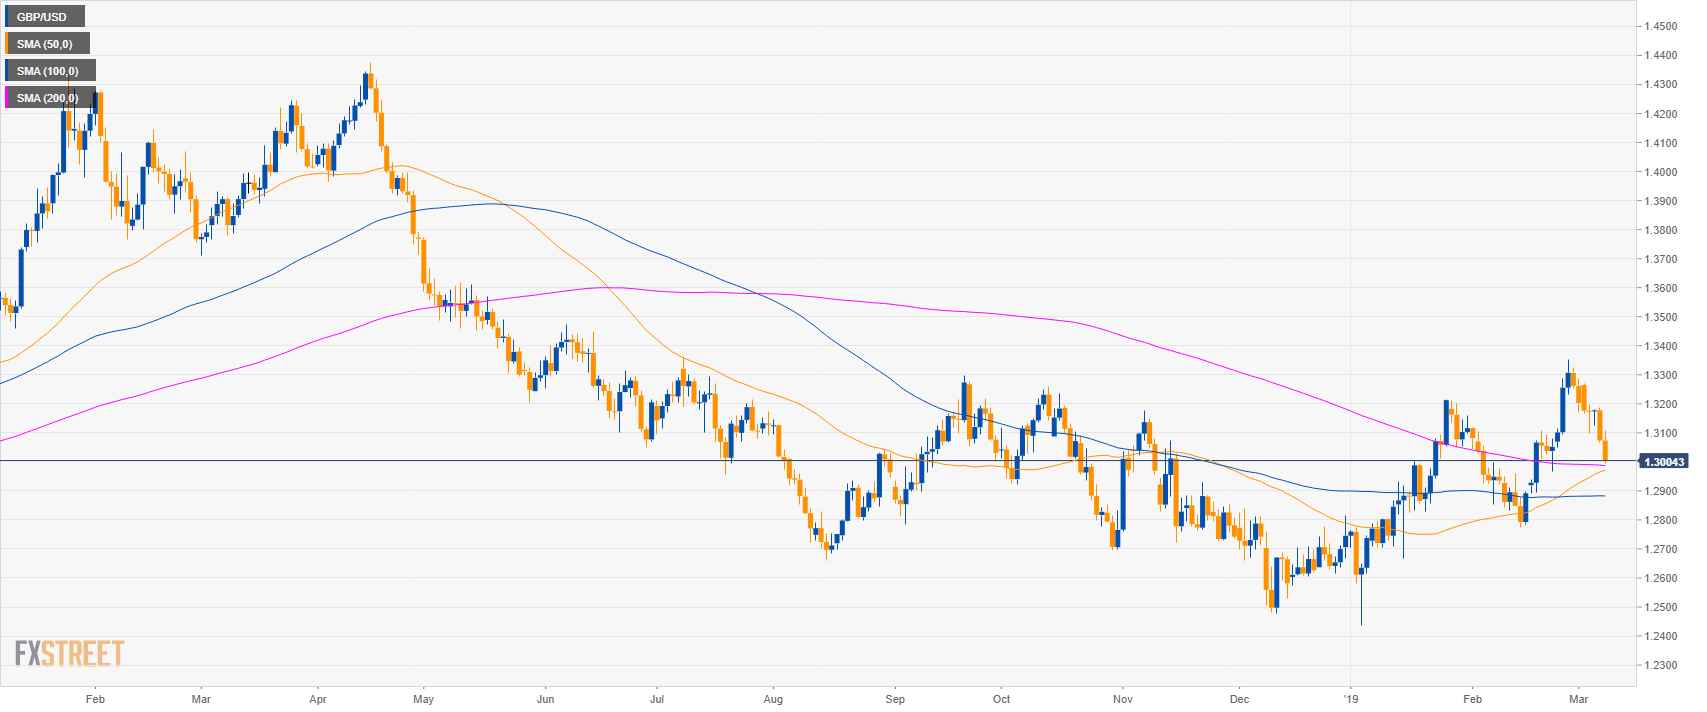
GBP/USD daily chart
- GBP/USD is pulling back down to its 100 and 200-day simple moving averages (SMAs).
- EU’s Brexit offer said to have already been rejected by UK.
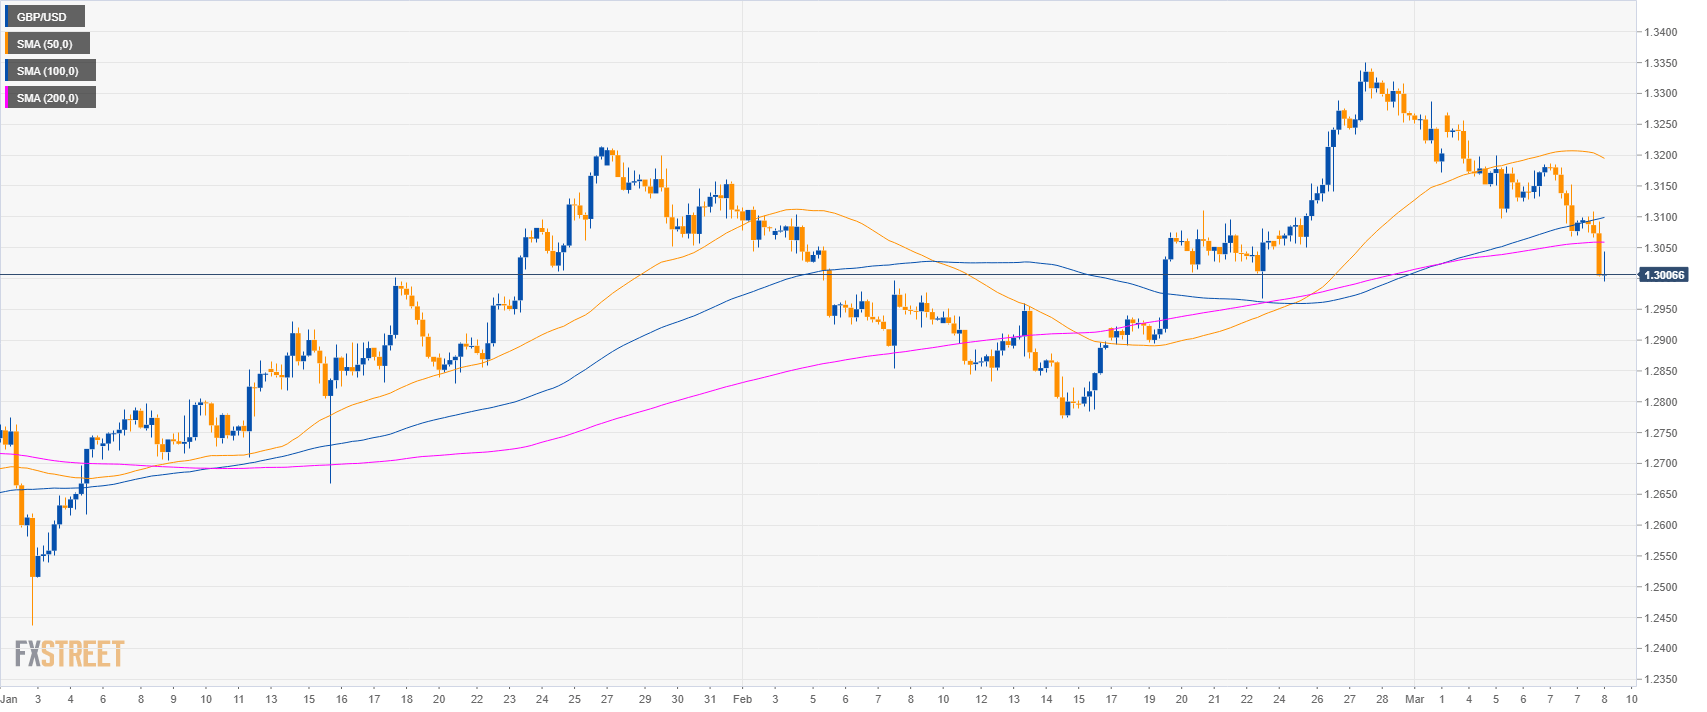
GBP/USD 4-hour chart
- GBP/USD broke below its main SMAs suggesting negative momentum in the medium-term.
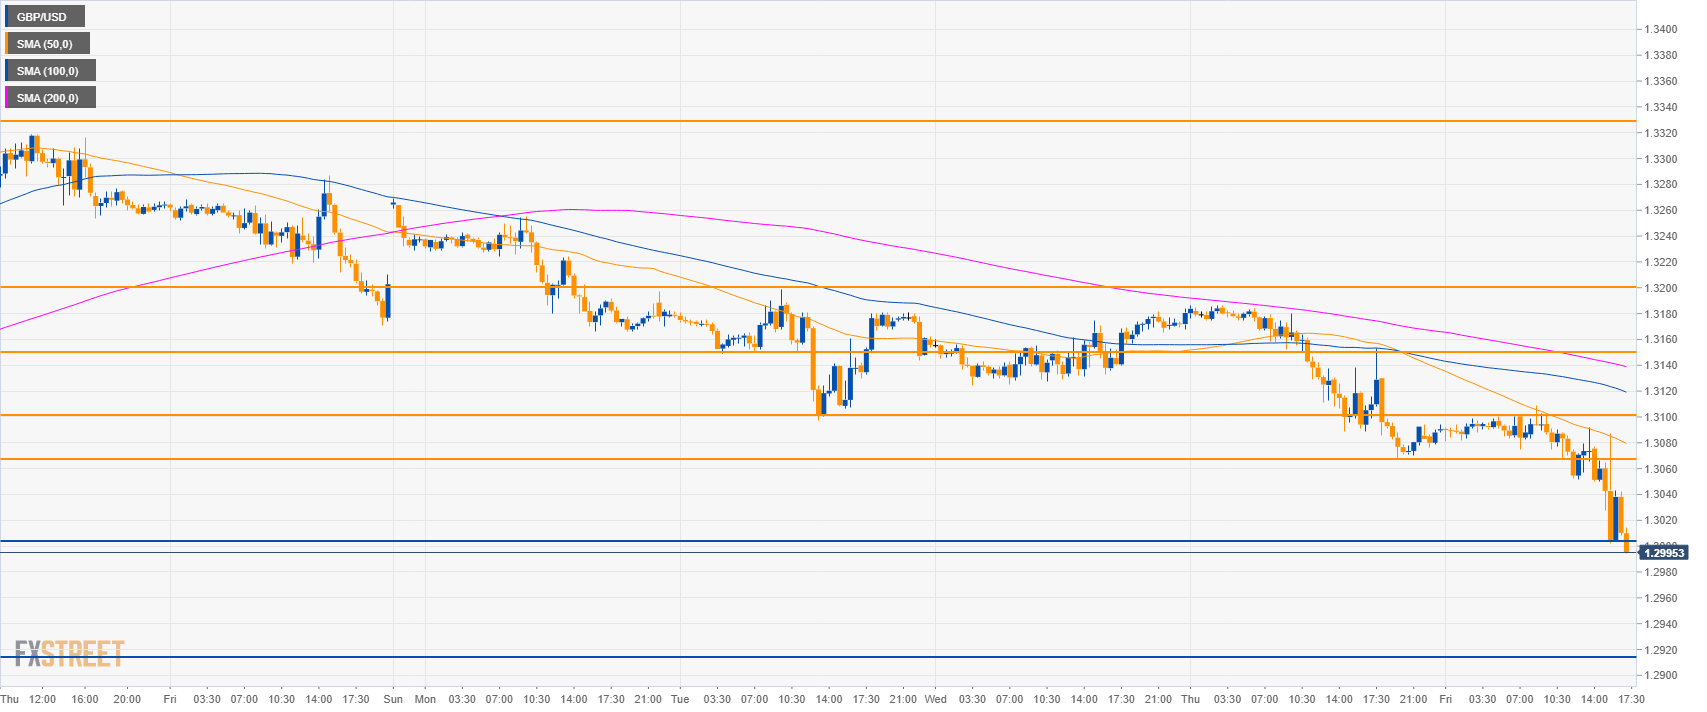
GBP/USD 30-minute chart
- GBP/USD is trading below its main SMAs suggesting a bearish bias.
- A break below 1.3000 figure can lead to the 1.2920 level.
- Resistances are at 1.3060 and 1.3100 figure.
Additional key levels
GBP/USD
Overview:
Today Last Price: 1.3004
Today Daily change: -70 pips
Today Daily change %: -0.54%
Today Daily Open: 1.3074
Trends:
Daily SMA20: 1.3055
Daily SMA50: 1.2965
Daily SMA100: 1.2883
Daily SMA200: 1.2988
Levels:
Previous Daily High: 1.3187
Previous Daily Low: 1.3068
Previous Weekly High: 1.3351
Previous Weekly Low: 1.3051
Previous Monthly High: 1.3351
Previous Monthly Low: 1.2773
Daily Fibonacci 38.2%: 1.3113
Daily Fibonacci 61.8%: 1.3141
Daily Pivot Point S1: 1.3032
Daily Pivot Point S2: 1.2991
Daily Pivot Point S3: 1.2914
Daily Pivot Point R1: 1.3151
Daily Pivot Point R2: 1.3228
Daily Pivot Point R3: 1.3269
