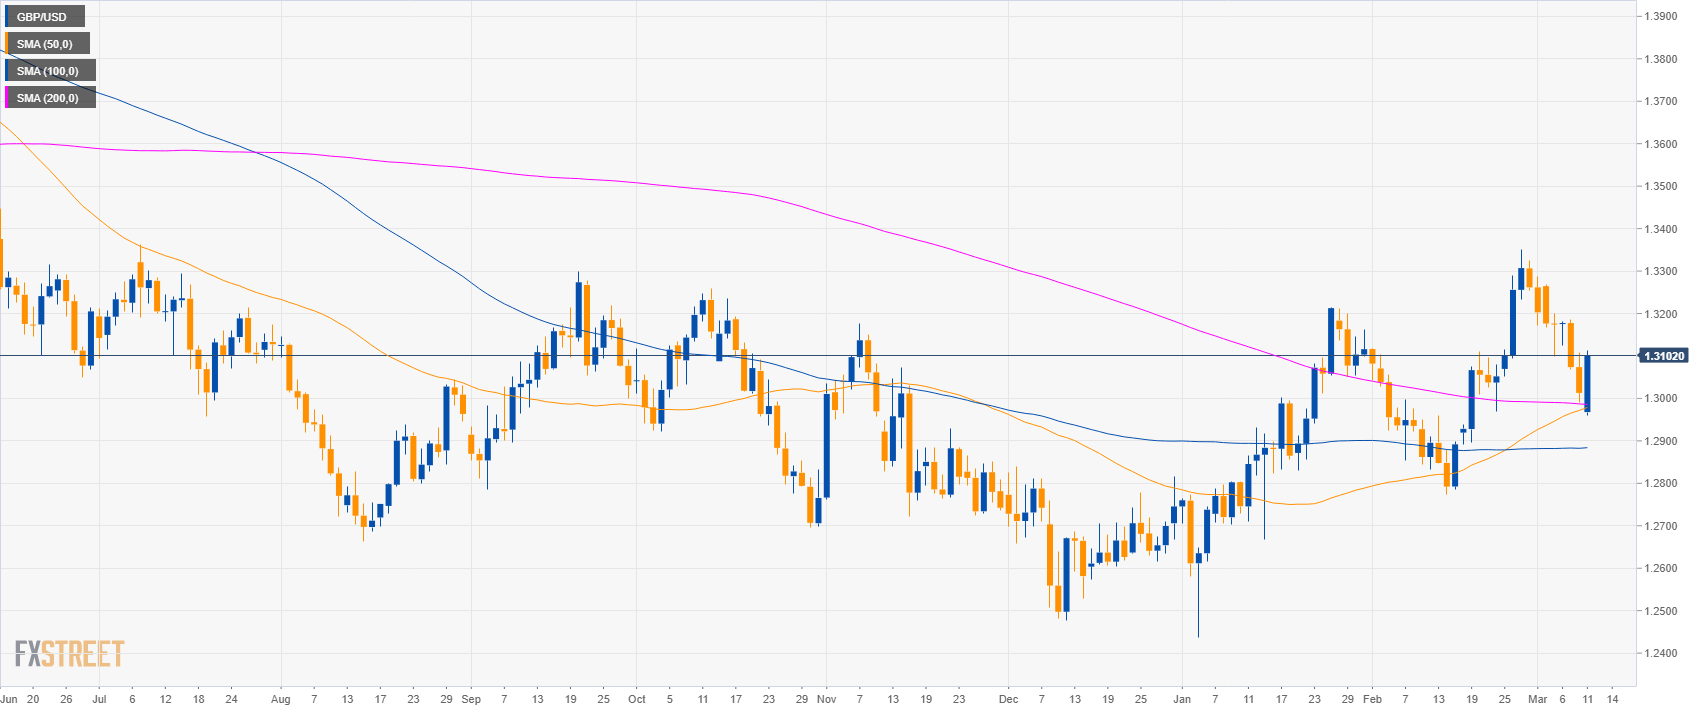
GBP/USD daily chart
- GBP/USD is trading above its main simple moving averages (SMAs) suggesting bullish momentum.
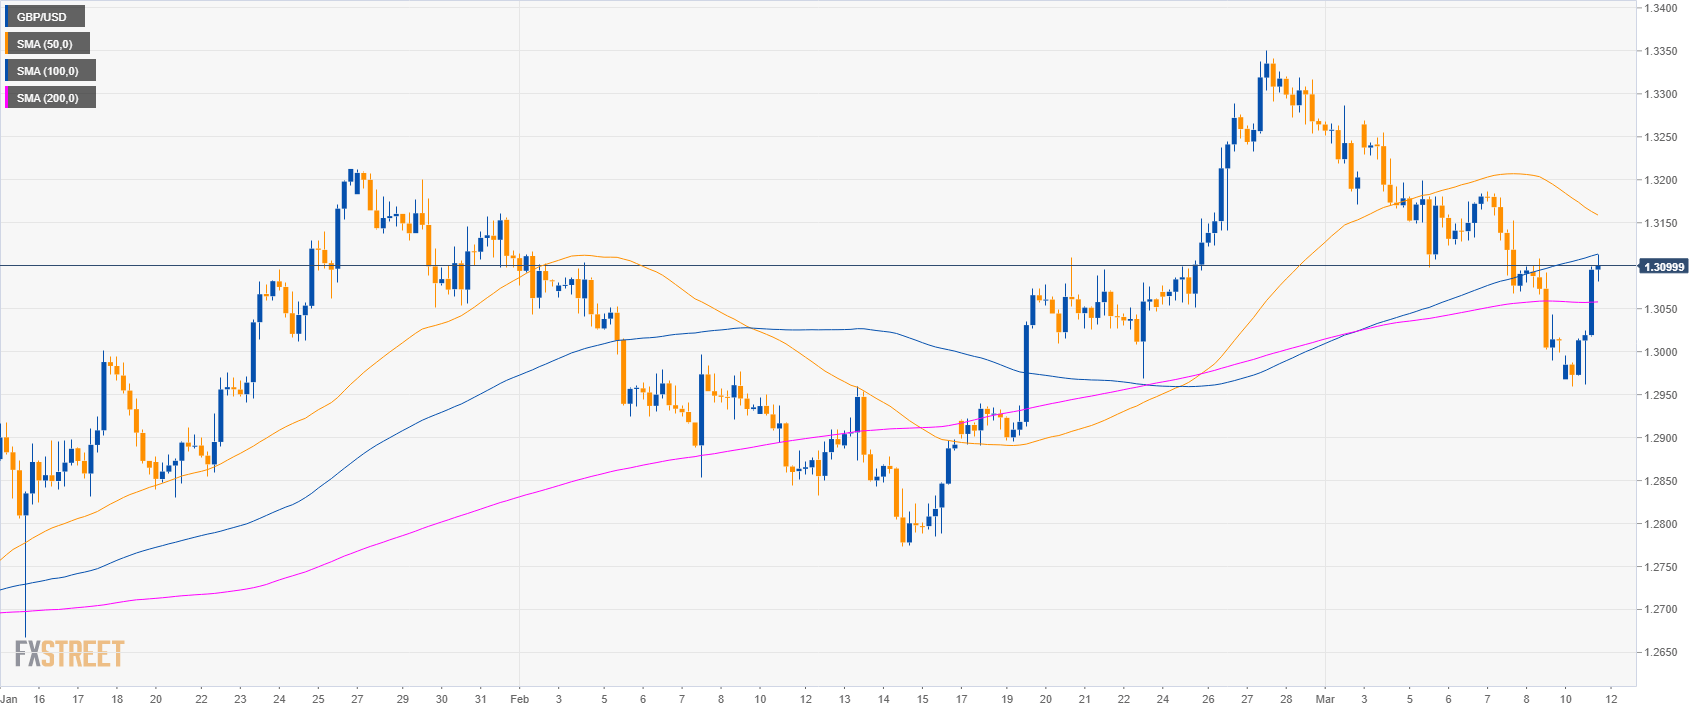
GBP/USD 4-hour chart
- GBP/USD is testing the 100 SMA and the 1.3100 figure.
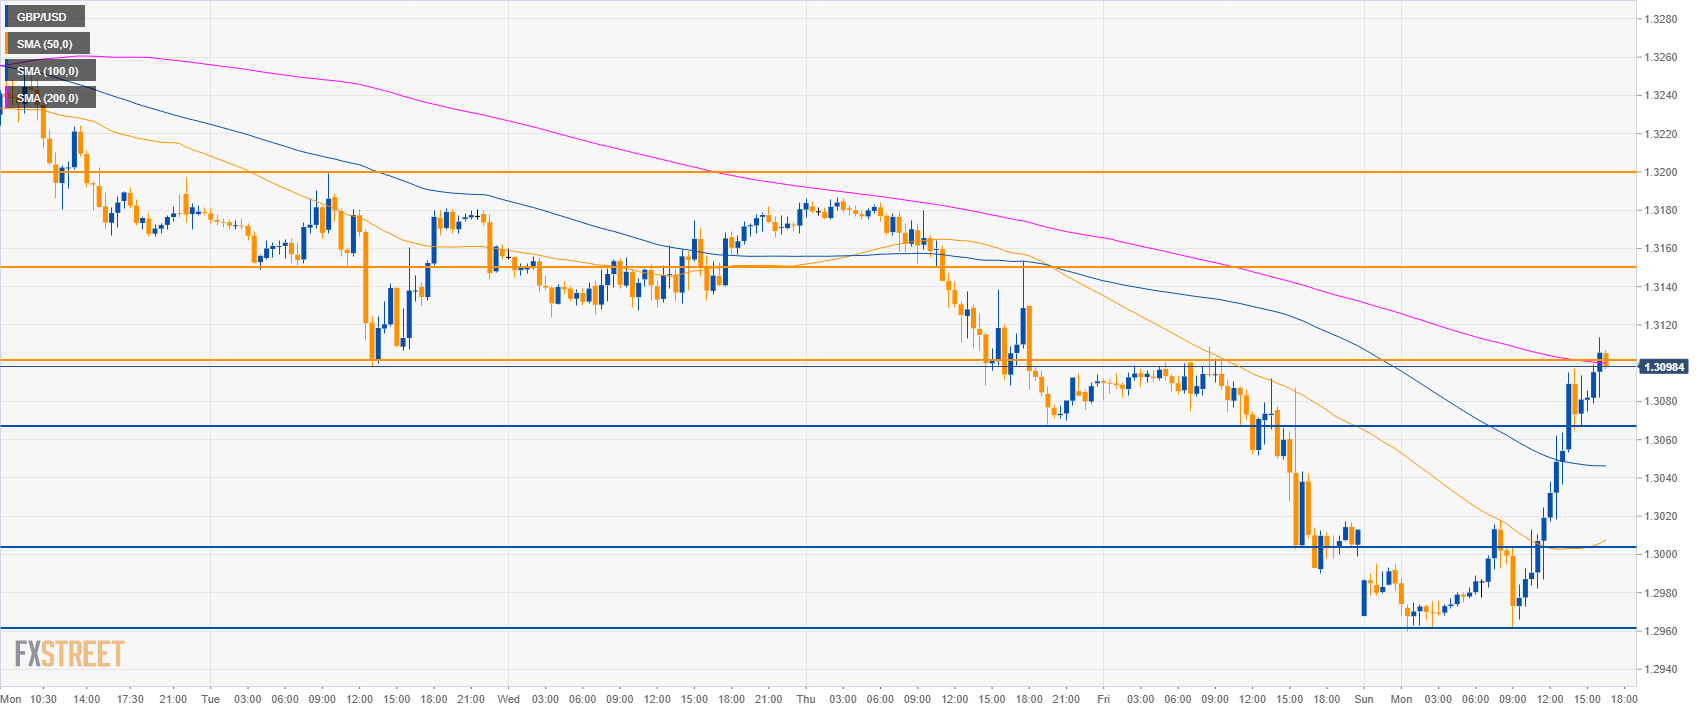
GBP/USD 30-minute chart
- GBP/USD is challenging the 200 SMA.
- A break above 1.3100 figure can lead to the 1.3150 level.
- Supports are at 1.3070 and 1.3000 level.
Additional key level:
GBP/USD
Overview:
Today Last Price: 1.3106
Today Daily change: 93 pips
Today Daily change %: 0.71%
Today Daily Open: 1.3013
Trends:
Daily SMA20: 1.3059
Daily SMA50: 1.2972
Daily SMA100: 1.2882
Daily SMA200: 1.2987
Levels:
Previous Daily High: 1.3109
Previous Daily Low: 1.299
Previous Weekly High: 1.3269
Previous Weekly Low: 1.299
Previous Monthly High: 1.3351
Previous Monthly Low: 1.2773
Daily Fibonacci 38.2%: 1.3035
Daily Fibonacci 61.8%: 1.3063
Daily Pivot Point S1: 1.2966
Daily Pivot Point S2: 1.2919
Daily Pivot Point S3: 1.2847
Daily Pivot Point R1: 1.3084
Daily Pivot Point R2: 1.3156
Daily Pivot Point R3: 1.3203
