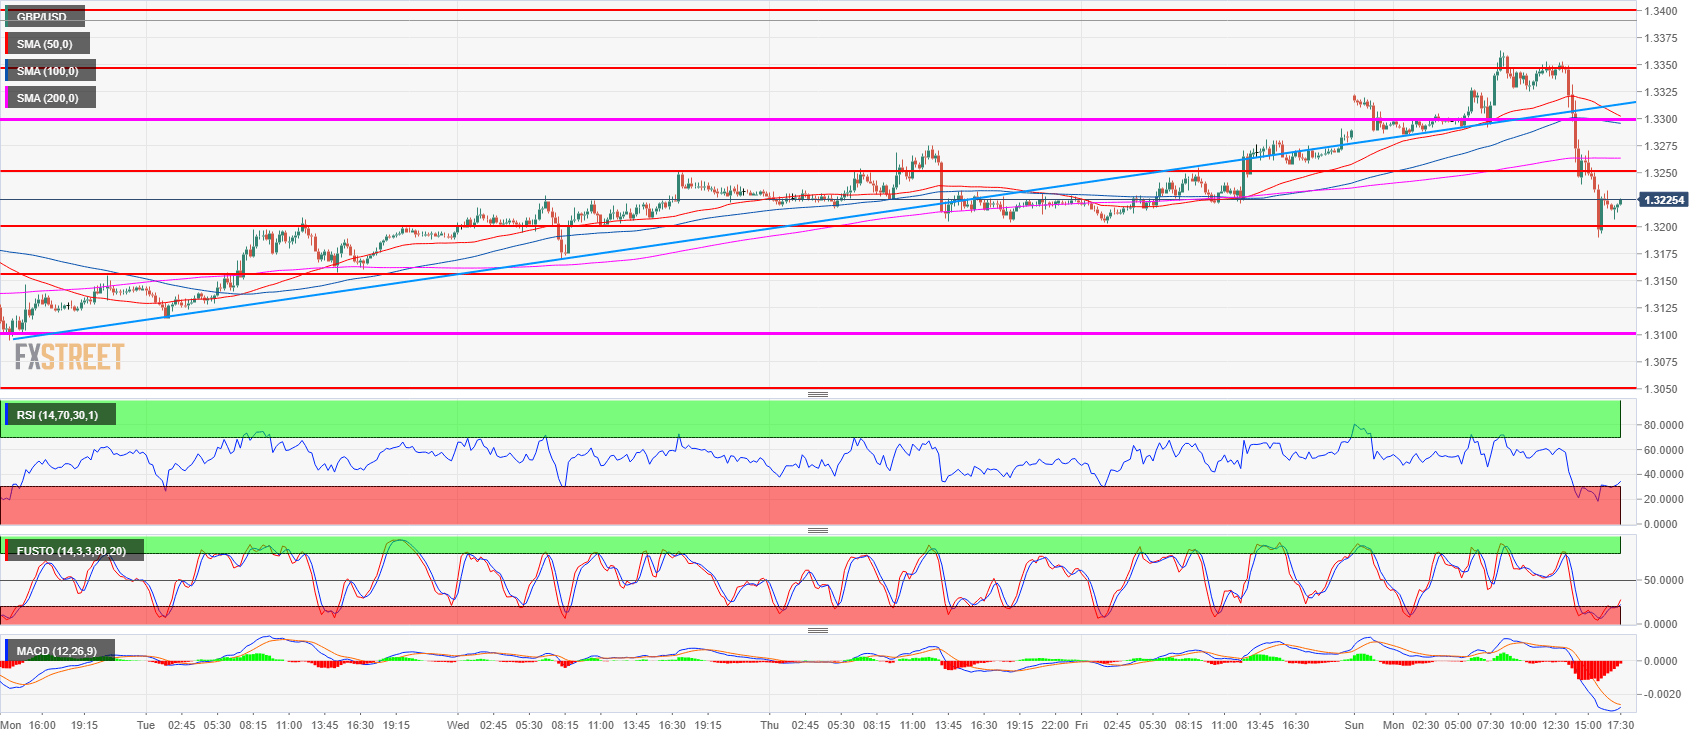
- GBP/USD bears have reversed all previous gains made this Monday and are en route to last Friday’s lows at 1.3203.
- Today’s sell-off suggests that GBP/USD last 300-pip run-up since June 28 might be a bear flag in a bear trend as opposed as the start of a new bull trend. A bear breakout below the 1.3200 figure might see the bull crowded trade unwind.
- On the other hand, if bulls manage to keep the market above 1.3200 and reclaim Monday’s high, it would suggest that the bull trend is quite strong and higher prices might be ahead.
GBP/USD 15-minute chart
Spot rate: 1.3224
Relative change: -0.48%
High: 1.3363
Low: 1.3189
Trend: Neutral to bearish
Resistance 1: 1.3250 June 4 high
Resistance 2: 1.3300-1.3314 June 22 swing high
Resistance 3: 1.3350 figure
Resistance 4: 1.3400 figure
Resistance 5: 1.3472 June’s high
Support 1: 1.3200 figure
Support 2: 1.3155 former breakout point
Support 3: 1.3100 figure
Support 4: 1.3049 current 2018 low
Support 5: 1.3027 October 6, 2017 swing low

