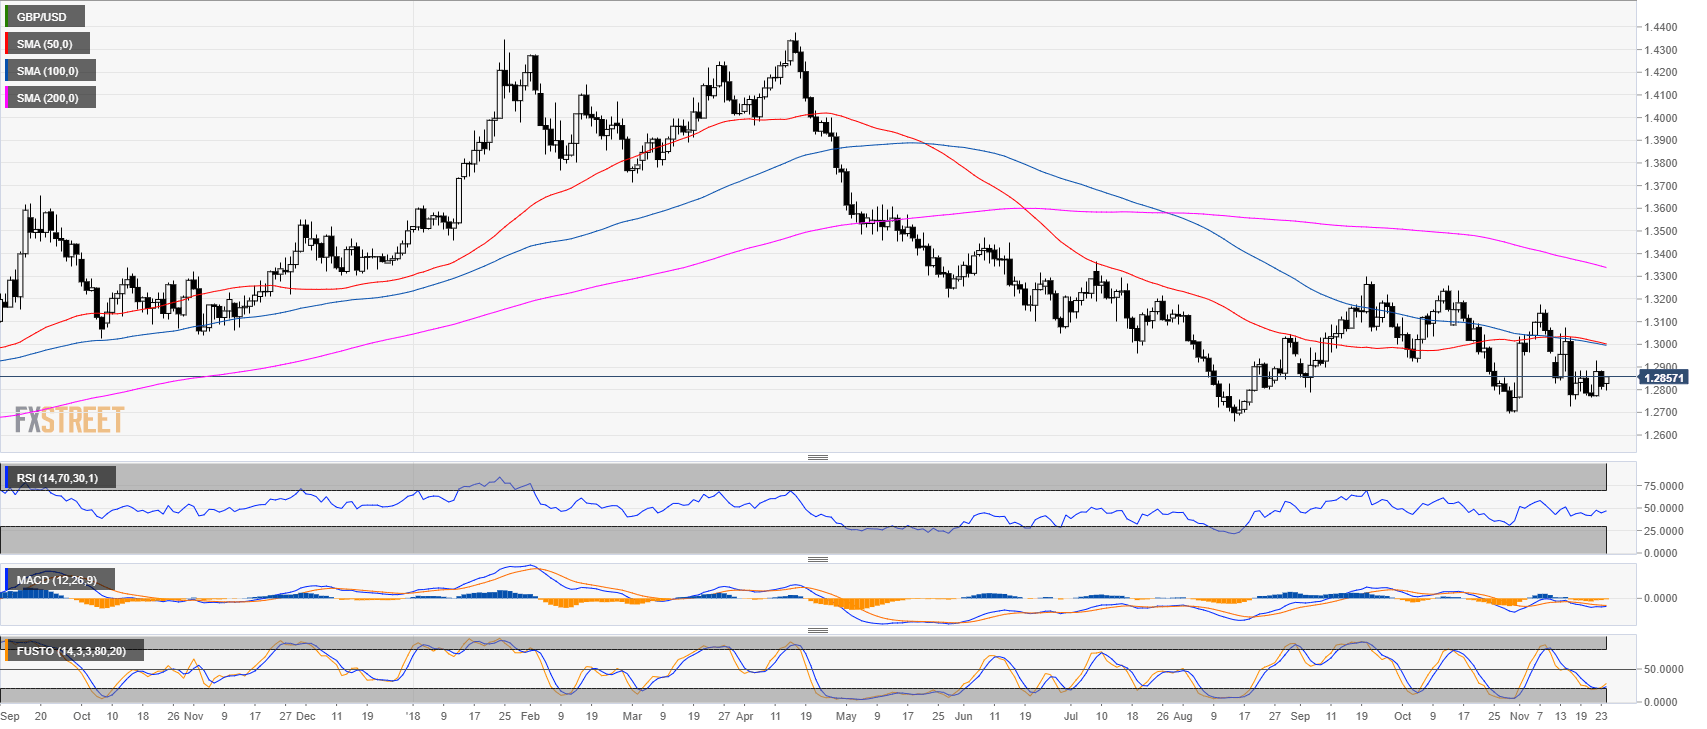
GBP/USD daily chart
- GBP/USD is trading below its main simple moving averages on the daily time-frame.
- GBP/USD is trading near the November lows as the RSI and Stochastic indicators are below the 50 line.
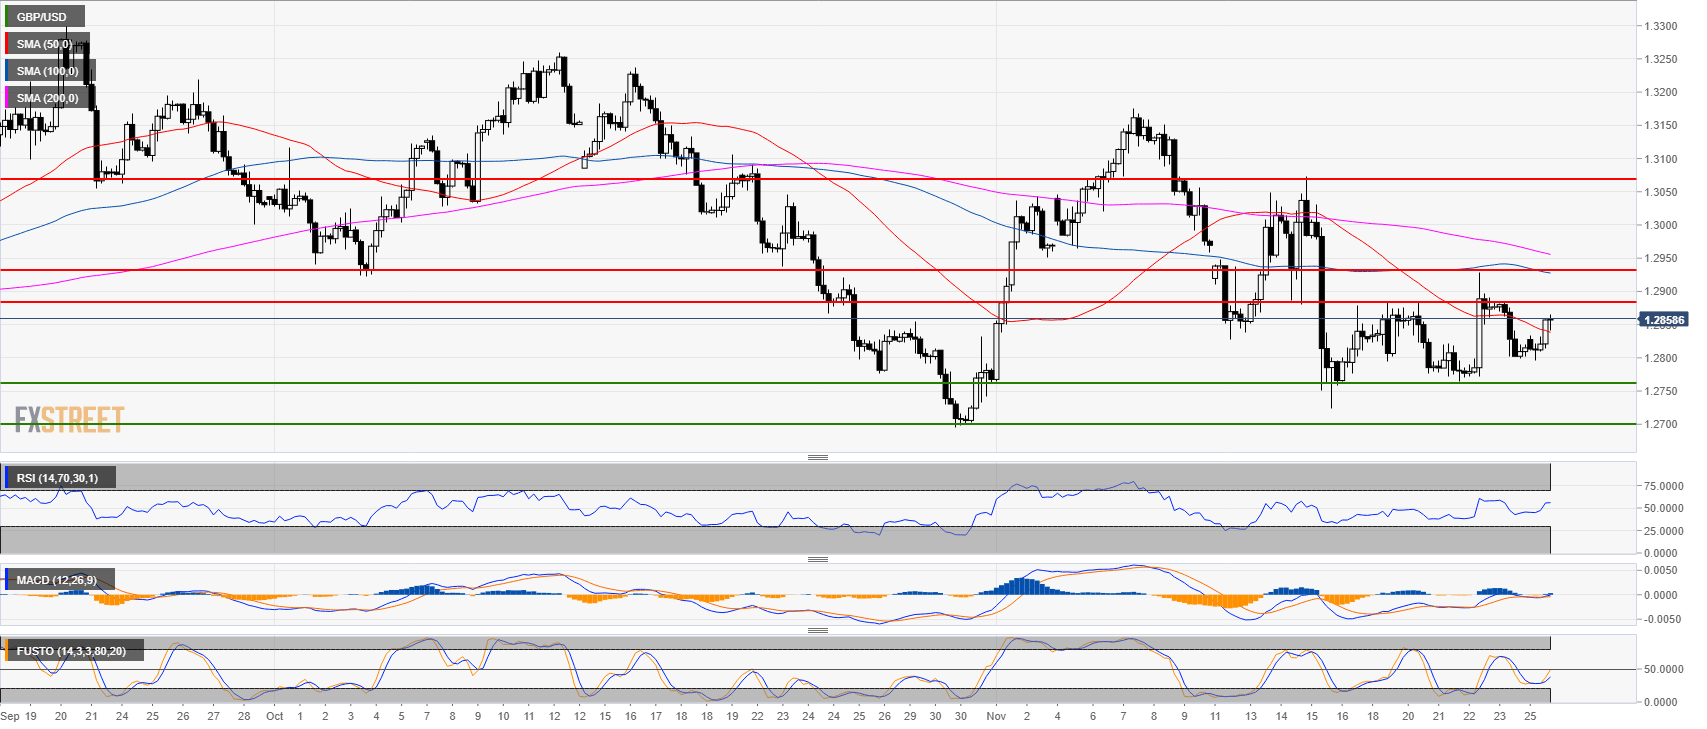
GBP/USD 4-hour chart
- GBP/USD bulls reclaimed the 50 SMA as the market is now trying to break above 1.2900 figure.
- Technical indicators are picking up steam suggesting potential bullish momentum.
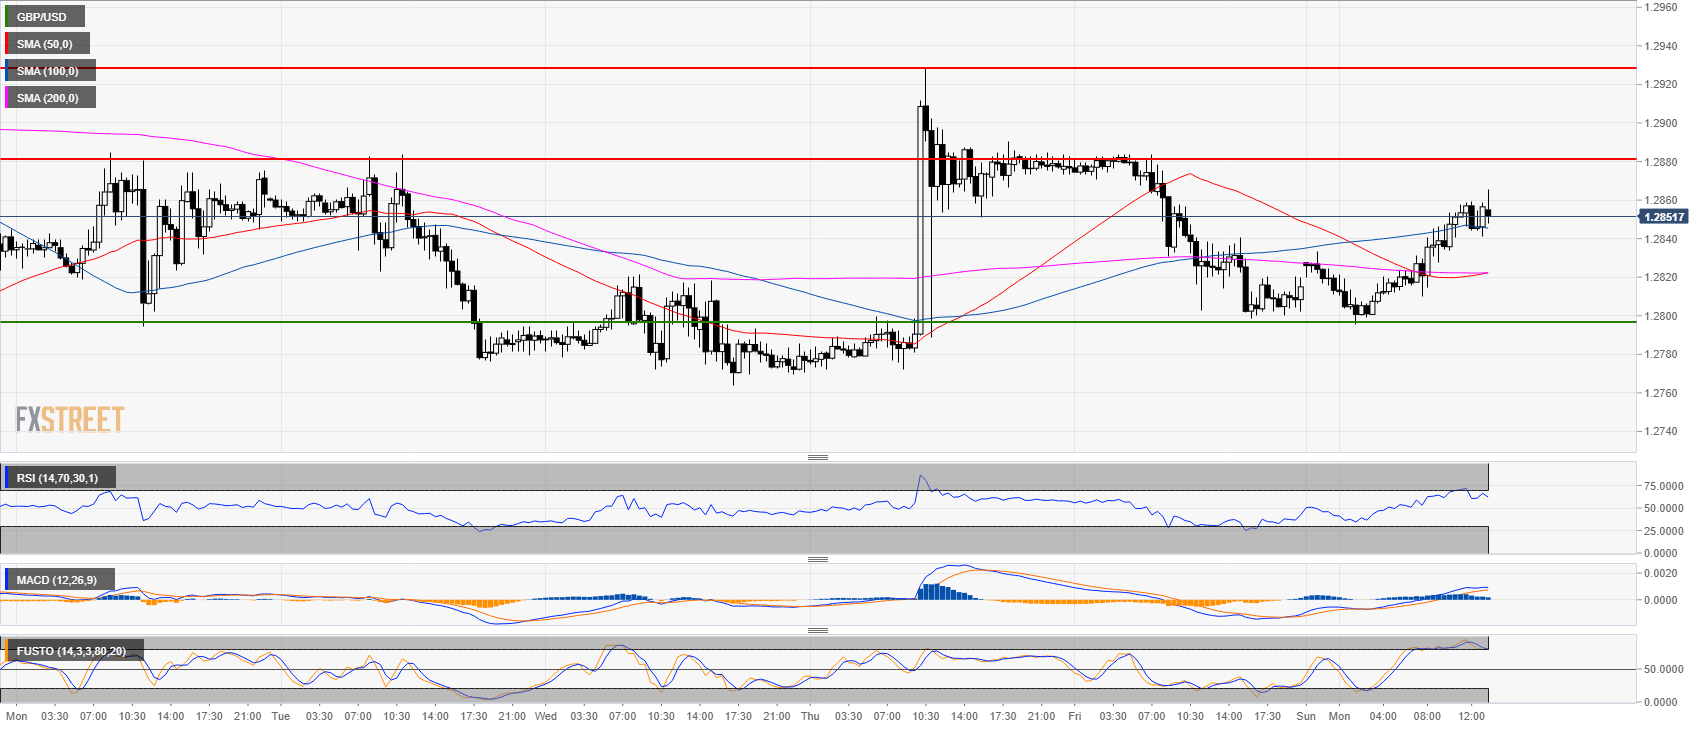
GBP/USD 30-minute chart
- GBP/USD bulls took the lead this Monday as they reclaimed the main SMAs.
- The level to beat for bulls is 1.2880 resistance while the main support is 1.2800 figure.
- Technical indicators are bullish however near overbought territories.
Additional key levels
GBP/USD
Overview:
Today Last Price: 1.2861
Today Daily change: 46 pips
Today Daily change %: 0.359%
Today Daily Open: 1.2815
Trends:
Previous Daily SMA20: 1.2904
Previous Daily SMA50: 1.3007
Previous Daily SMA100: 1.3
Previous Daily SMA200: 1.3347
Levels:
Previous Daily High: 1.2885
Previous Daily Low: 1.2799
Previous Weekly High: 1.2928
Previous Weekly Low: 1.2764
Previous Monthly High: 1.326
Previous Monthly Low: 1.2696
Previous Daily Fibonacci 38.2%: 1.2832
Previous Daily Fibonacci 61.8%: 1.2852
Previous Daily Pivot Point S1: 1.2781
Previous Daily Pivot Point S2: 1.2747
Previous Daily Pivot Point S3: 1.2695
Previous Daily Pivot Point R1: 1.2867
Previous Daily Pivot Point R2: 1.2919
Previous Daily Pivot Point R3: 1.2953
