- The Sterling is consolidating its intraday gains near key resistance in the New York session.
- Support is seen at 1.2340 and 1.2315 price levels, according to the Technical Confluences Indicator.
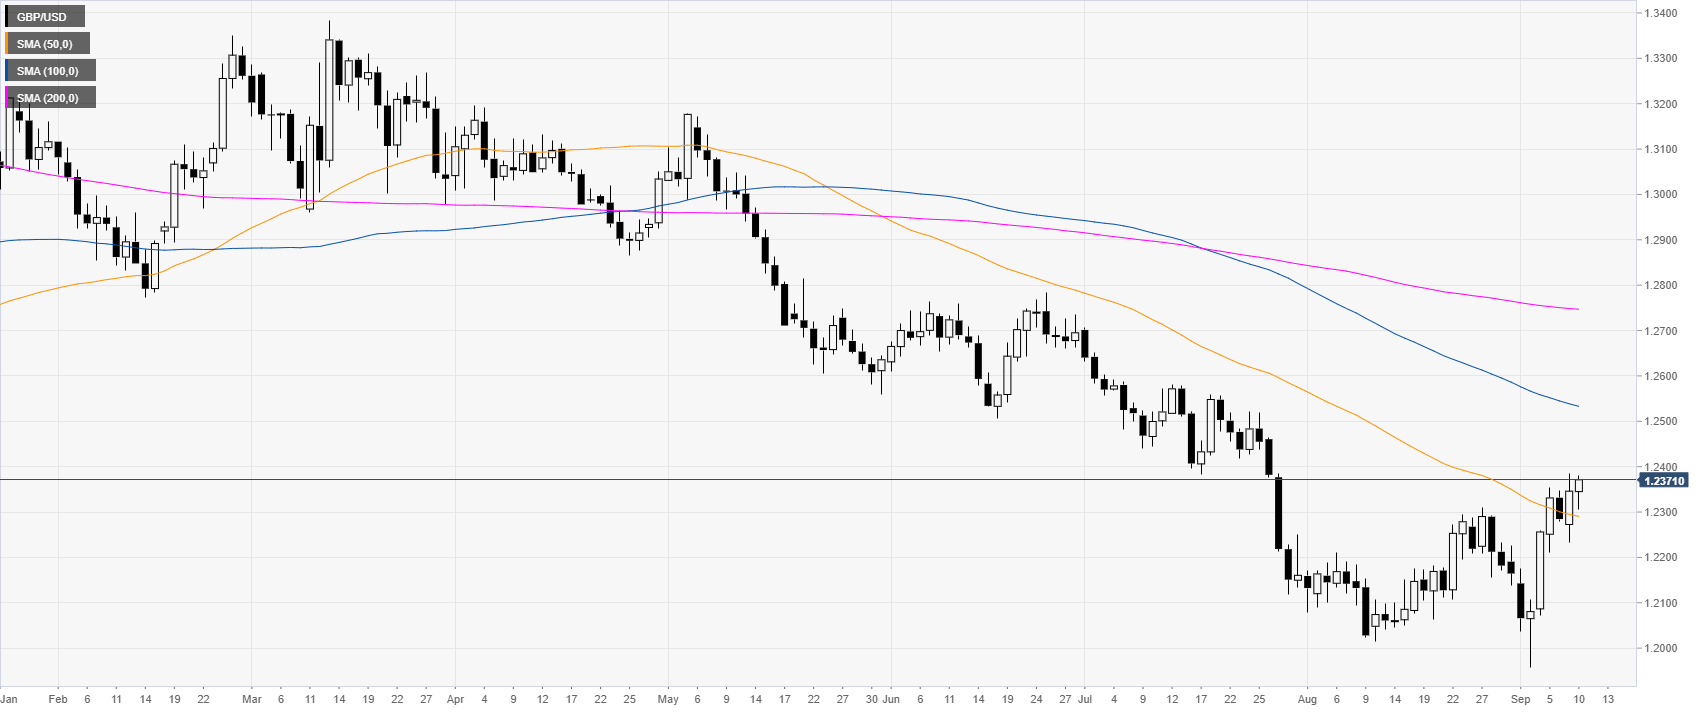
GBP/USD daily chart
GBP/USD is trading in a bear trend below the 100 and 200-day simple moving averages (SMAs). However, Sterling is trying to create a double bottom as the market is nearing the 1.2400 figure.
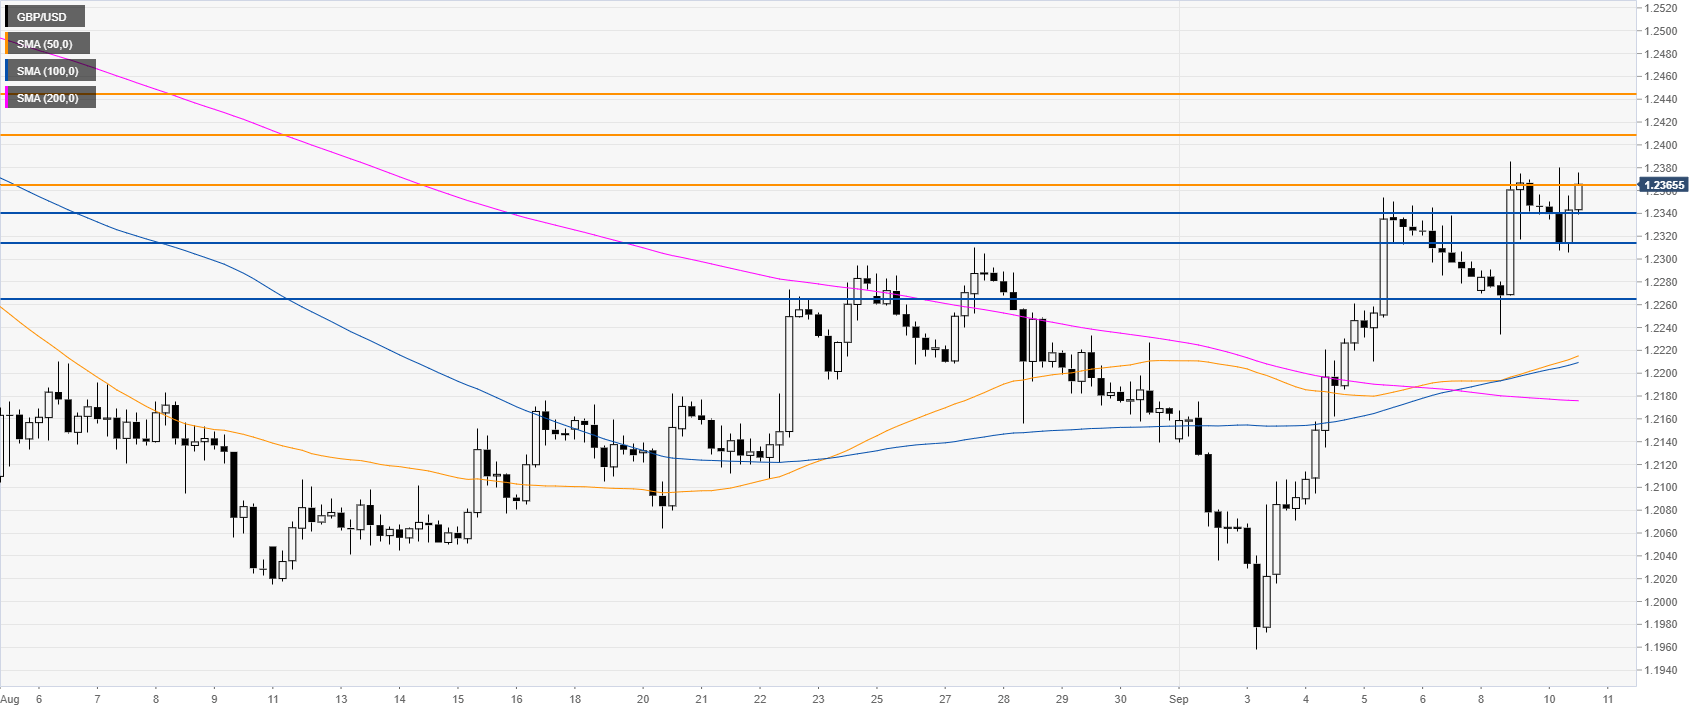
GBP/USD four-hour chart
GBP/USD is consolidating the intraday gains just near the 1.2366 key resistance as the market is trading above its main SMAs. Bulls’ objective is to climb above 1.2366 on a daily closing basis. The next resistances on the way up can be at 1.2410 and 1.2444 price levels, according to the Technical Confluences Indicator.
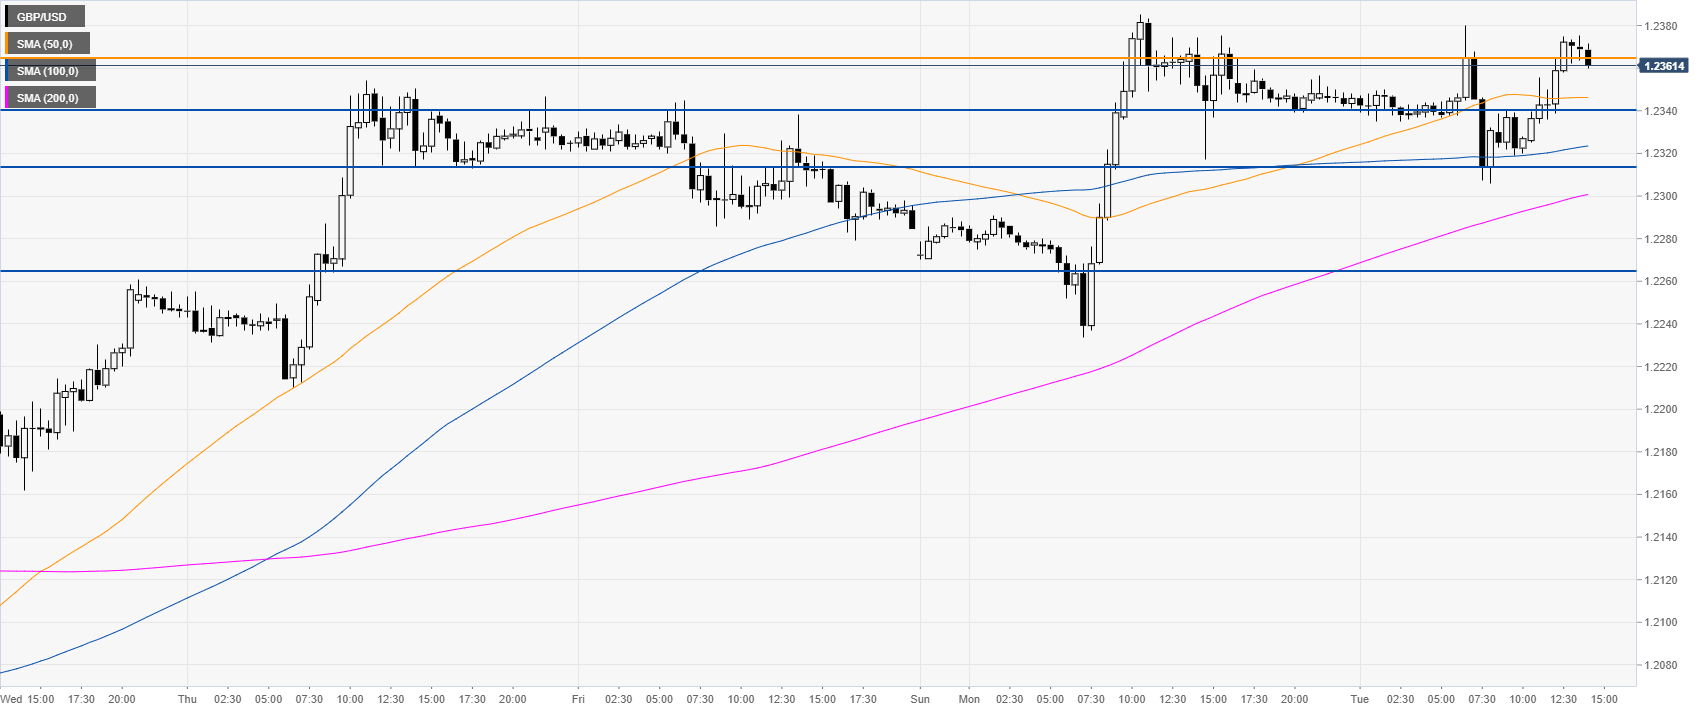
GBP/USD 30-minute chart
The Pound is trading above its main SMAs, suggesting bullish momentum in the near term. Bears need to reclaim the 1.2341 and 1.2315 support to generate a more meaningful retracement towards 1.2263 support, according to the Technical Confluences Indicator.
Additional key levels
