- GBP/USD main bear trend is switching to bullish as Cable is trading above the 50-day simple moving average.
- GBP/USD found resistance at the 1.3200 figure and the 50-period simple moving average as the RSI, MACD and Stochastics indicators are weakening. All suggesting that the bearish pullback can extend towards 1.3050 and 1.3000 figure.
- A bull breakout above 1.3200 would invalidate the short-term bearish bias.
GBP/USD 4-hour chart
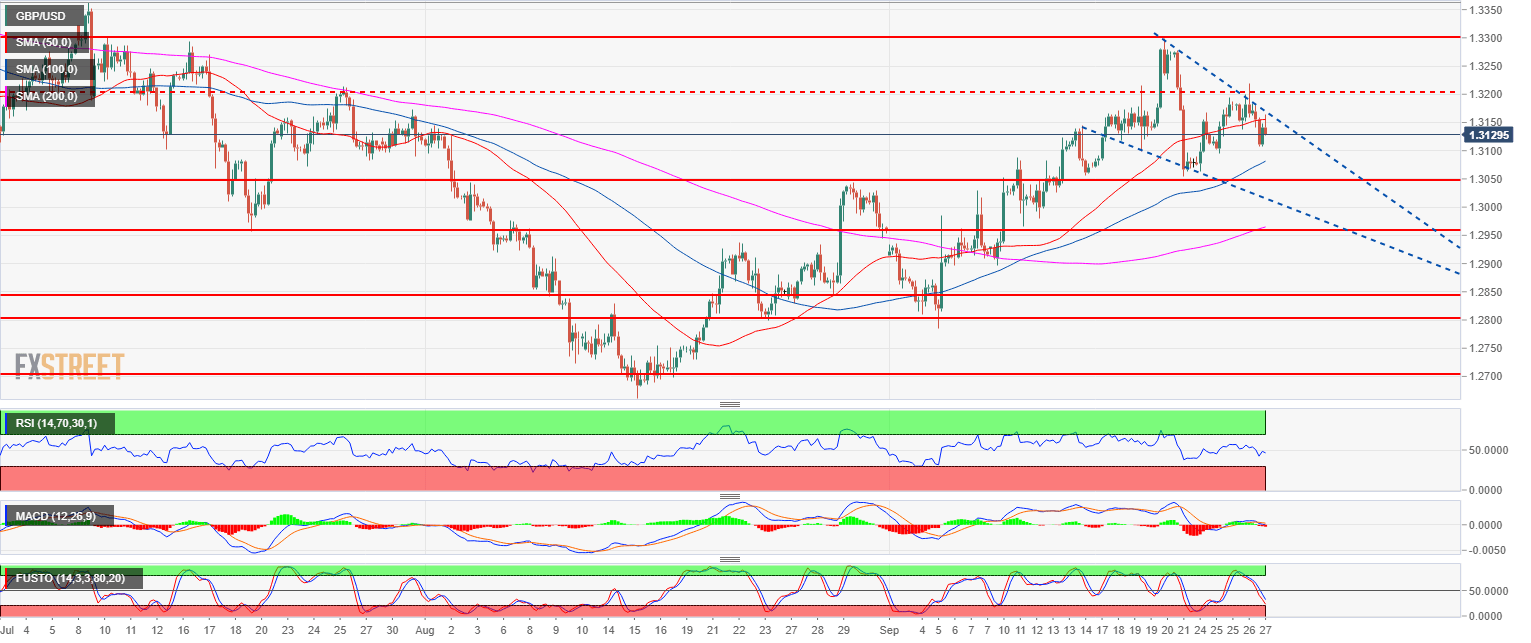
Spot rate: 1.3127
Relative change: -0.59%
High: 1.3184
Low: 1.3108
Main trend: Bullish
Resistance 1: 1.3144 key level
Resistance 2: 1.3200 figure (key support/resistance)
Resistance 3: 1.3300 figure
Resistance 4: 1.3363 July high
Resistance 5: 1.3472 June 7 high
Support 1: 1.3100 figure
Support 2: 1.3050 August 30 swing high, key level
Support 3: 1.3000 figure
Support 4: 1.2957 July 19 swing low
