- GBP/USD is at its lowest since March 2017.
- The 1.2189 level can be the next pit-stop for bears, according to the Technical Confluences Indicator.
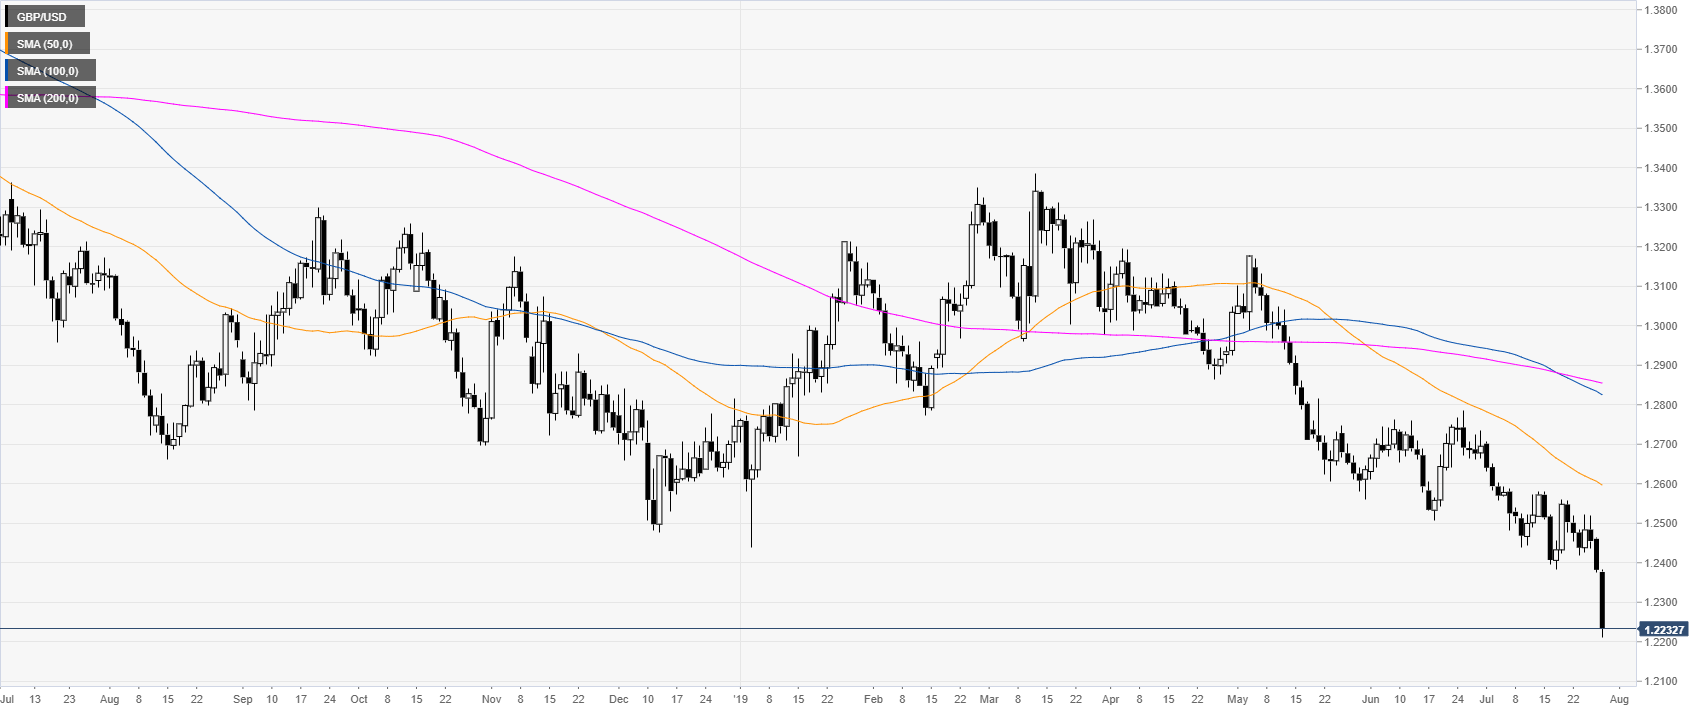
GBP/USD daily chart
Cable is sharply down to multi-month lows as a no-deal Brexit is looming.
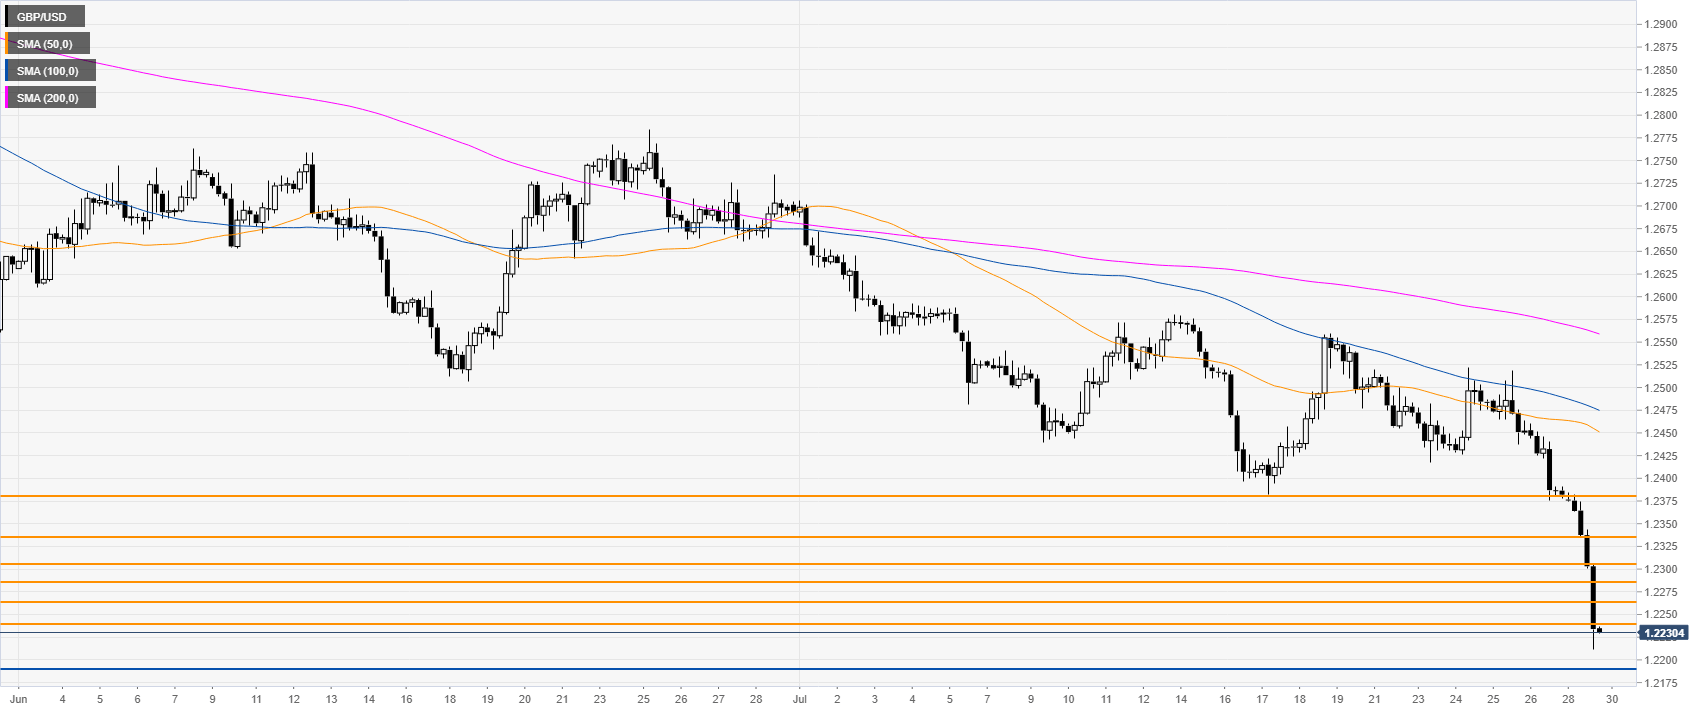
GBP/USD 4-hour chart
GBP/USD is trading below the 1.2240 support as the market made a vertical move down this Monday. Bears objective is to reach 1.2189 on the way down, according to the Technical Confluences Indicator.
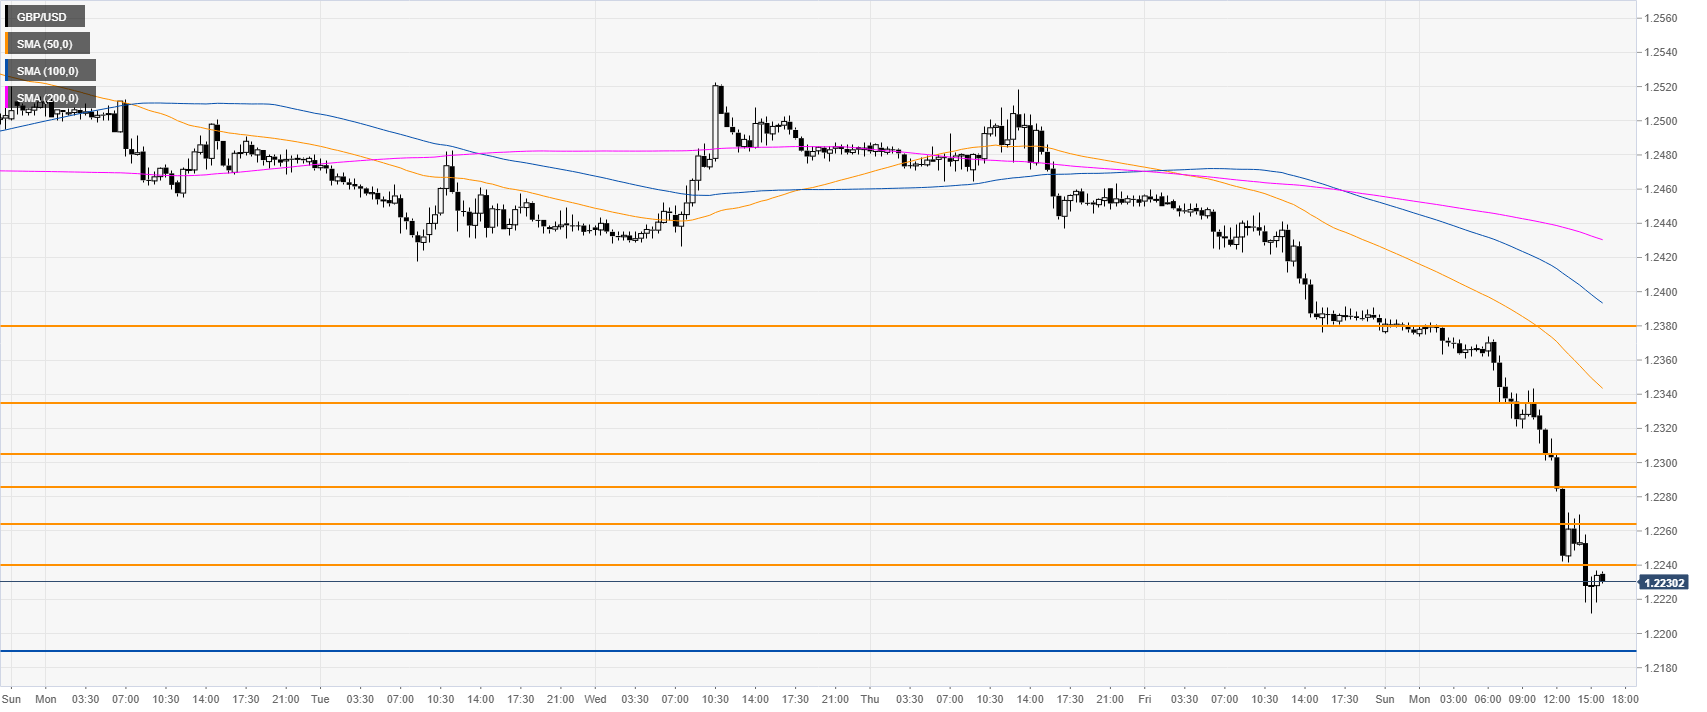
GBP/USD 30-minute chart
Cable is trading near daily lows as the sellers generated a strong bear move. Resistances are seen near 1.2240, 1.2264, 1.2285, 1.2304, 1.2336 and 1.2381, according to the Technical Confluences Indicator.
Additional key levels
