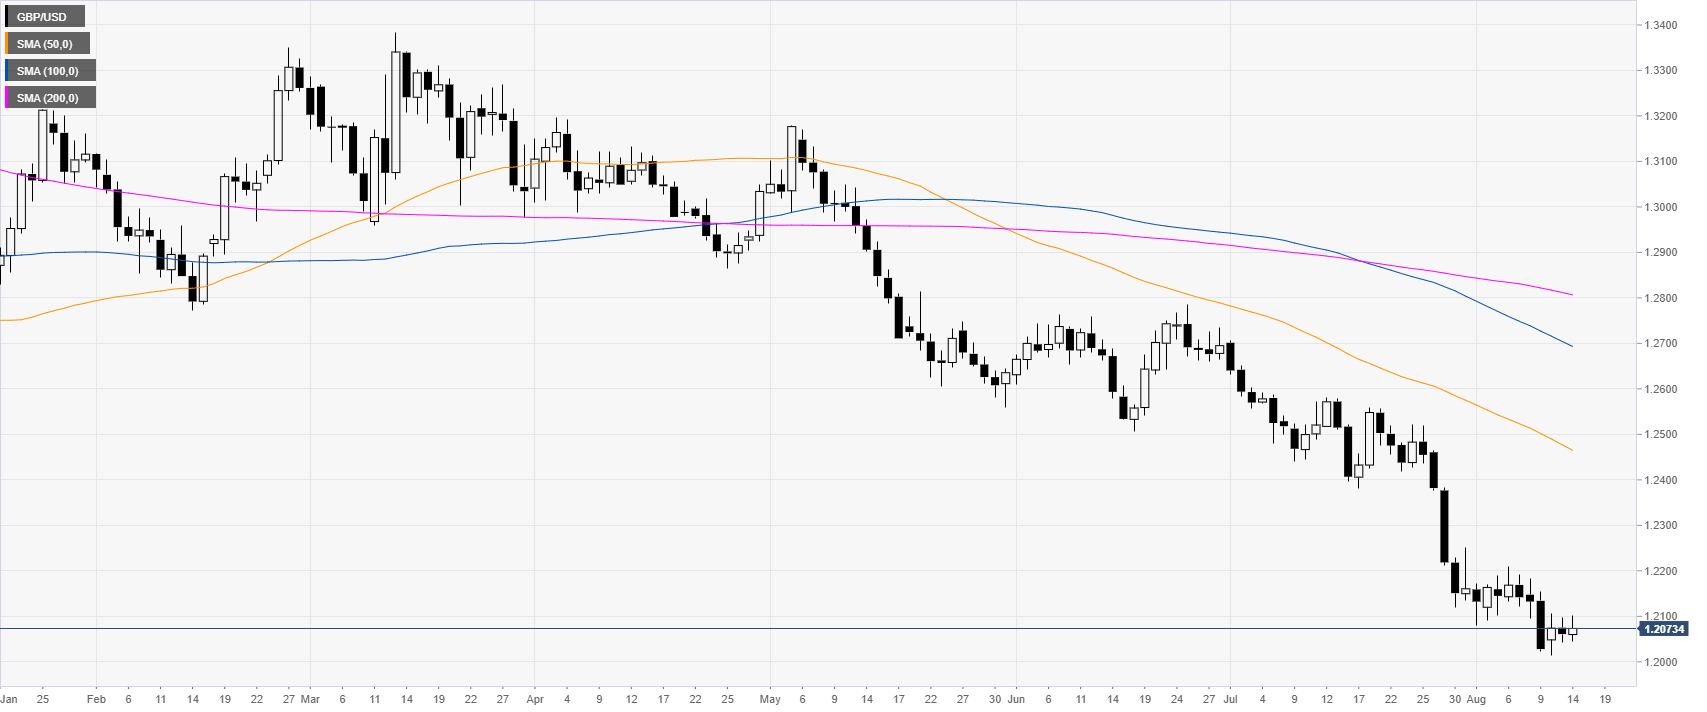
- The bear trend remains intact as GBP/USD is hovering near multi-month lows.
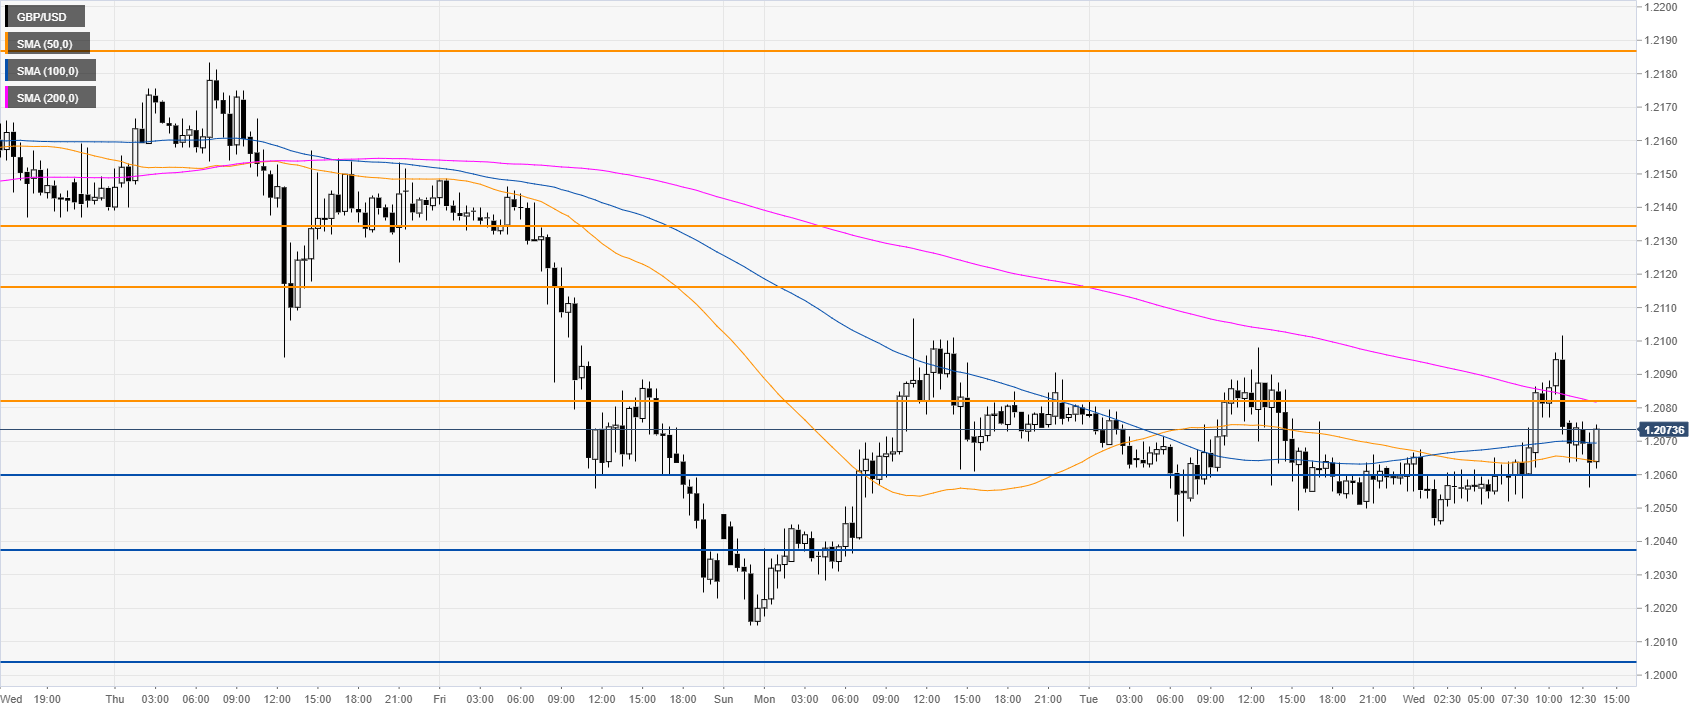
- The levels to beat for bears are seen at 1.2060 and 1.2036 supports.
GBP/USD daily chart
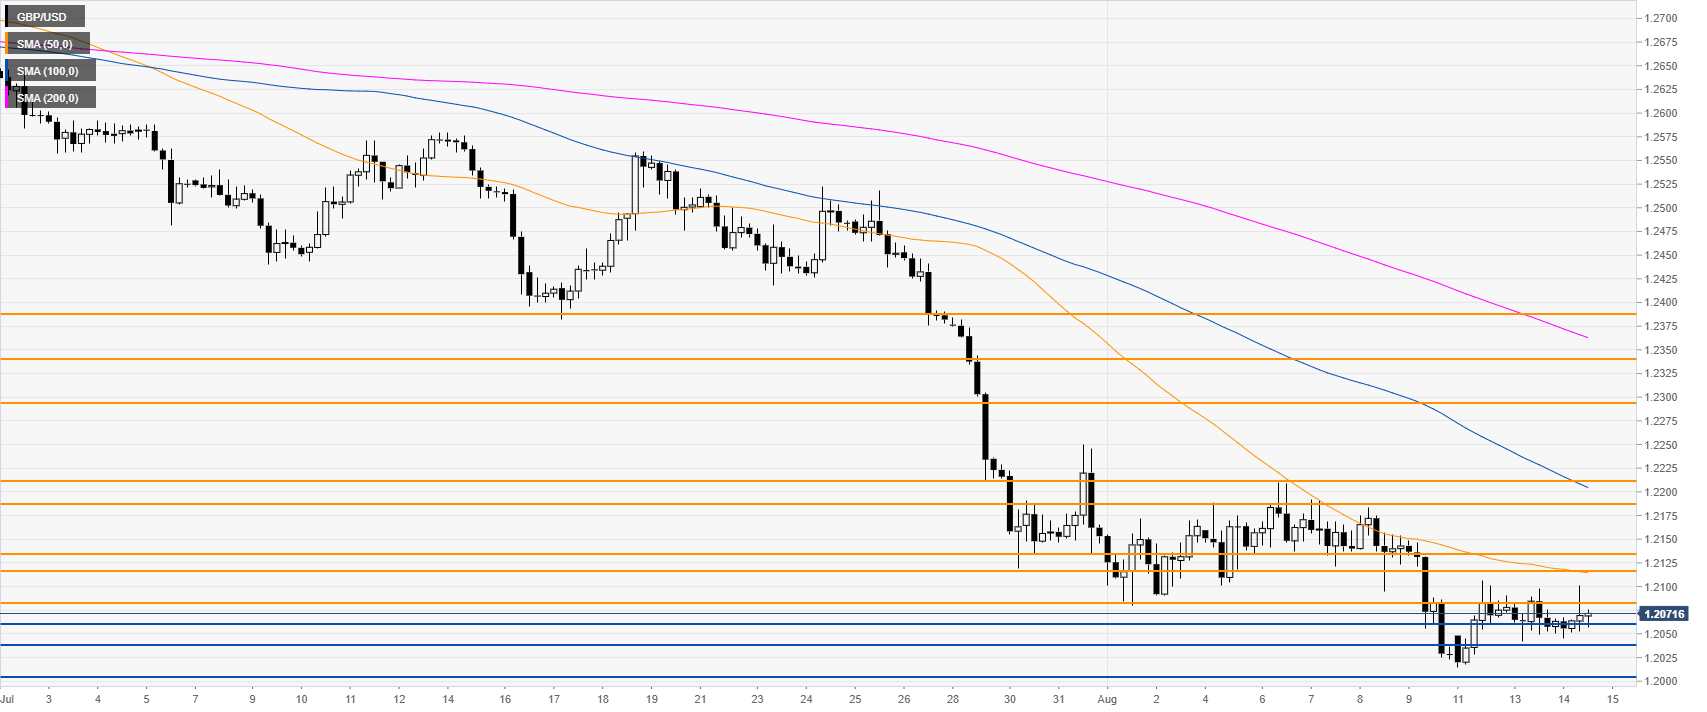
The Cable remains under bearish pressure as the market reached a new multi-month low at the 1.2015 level at the start of the week. The market is for now capped below the 1.2100 resistance. Earlier in the day, the UK inflation YoY came in at 2.1% vs. 1.9% and GBP/USD had an intraday spike above the 1.2085 level which has been retraced.
GBP/USD 4-hour chart
GBP/USD is trading below its main simple moving averages (SMAs), suggesting a bearish bias in the medium term. The market faded the 1.2085 resistance one more time this Wednesday. Bulls would need to reclaim the 1.2085 and 1.2116 resistances, followed by the 1.2135 and 1.2154 levels.
GBP/USD 30-minute chart
The Cable is trading between the 200 and 50 SMA suggesting a consolidation phase in the near term. Sellers need to break below 1.2060/1.2036 levels to reach 1.2003 and 1.1952 on the way down, according to the Technical Confluences Indicator.
Additional key levels
