- GBP/USD is trading at its highest in August, reaching 1.2310 on an intraday basis.
- The levels to beat for bulls are seen at 1.2329, followed by 1.2361 resistances.
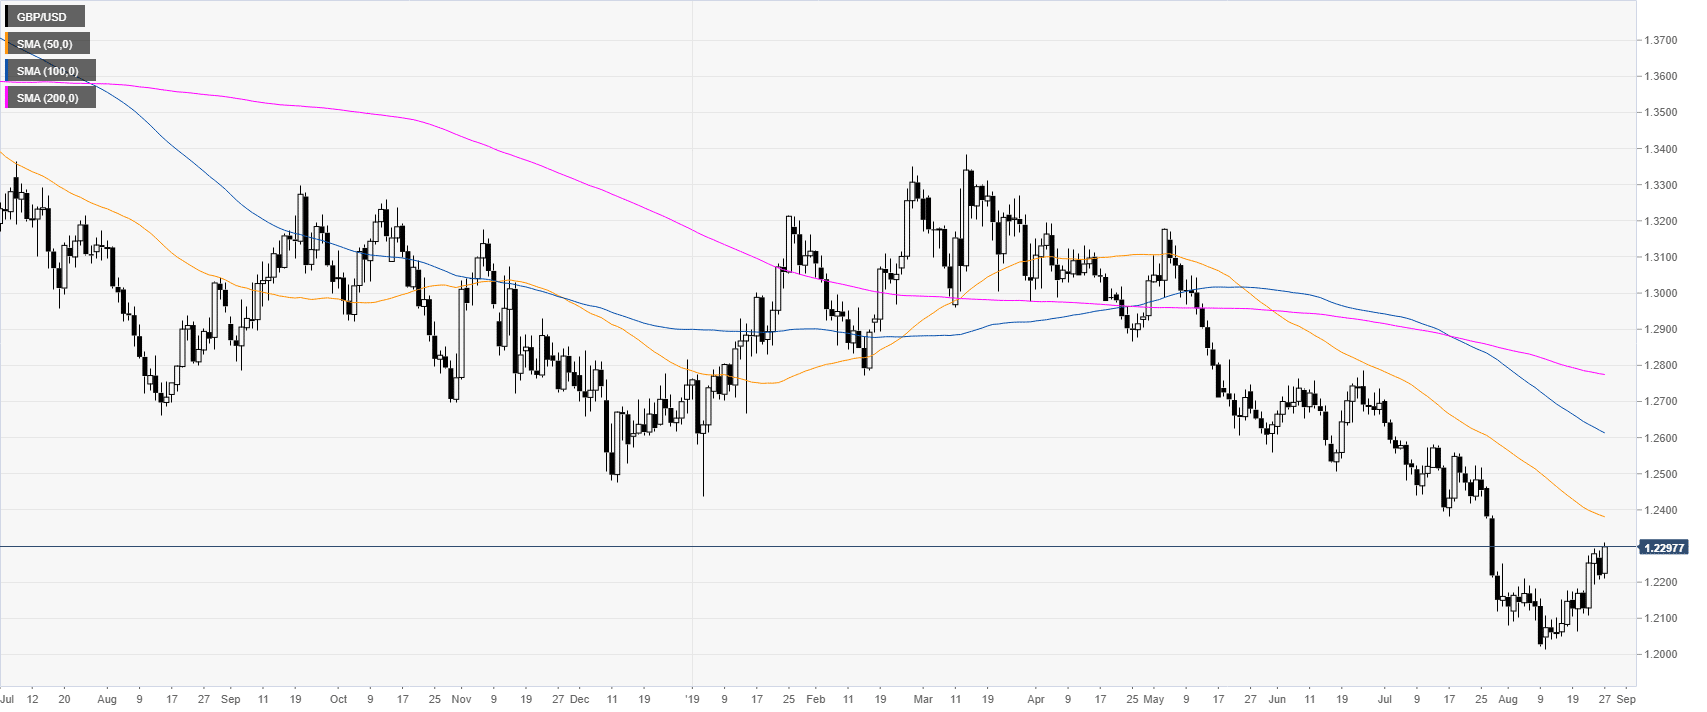
GBP/USD daily chart
GBP/USD is trading in a bear trend below the main daily simple moving averages (SMAs). However, the market has been bouncing in the last two weeks after establishing a 2019 low at the 1.2015 level.
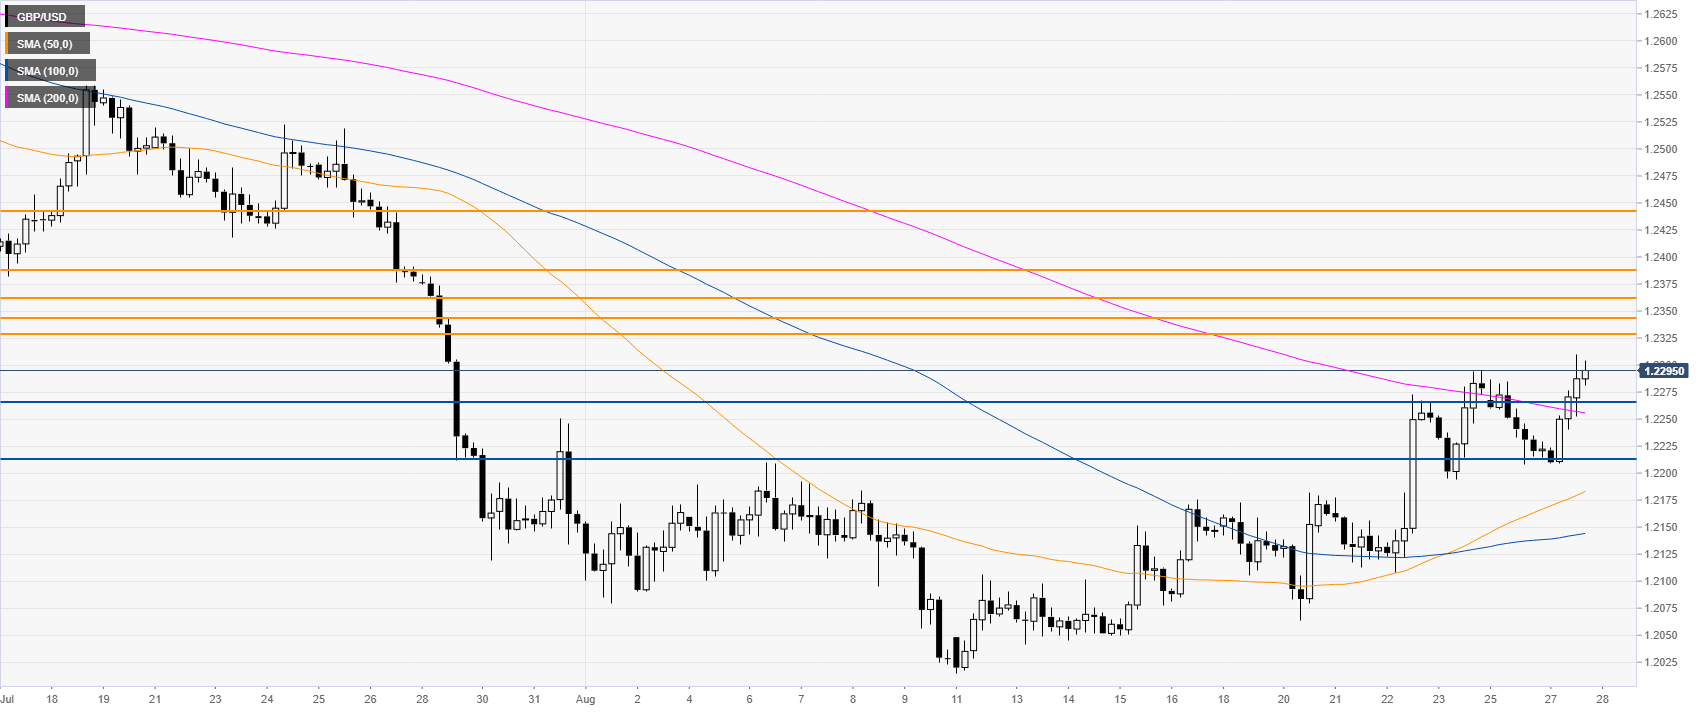
GBP/USD 4-hour chart
The Cable broke to new August highs above the 200 SMA on the 4-hour chart. Bulls have now a dense cluster of resistance to deal with. If the buyers manage to work their way through 1.2329/1.2348 and 1.2361, the market could reach 1.2386 on the way up, according to the Technical Confluences Indicator.
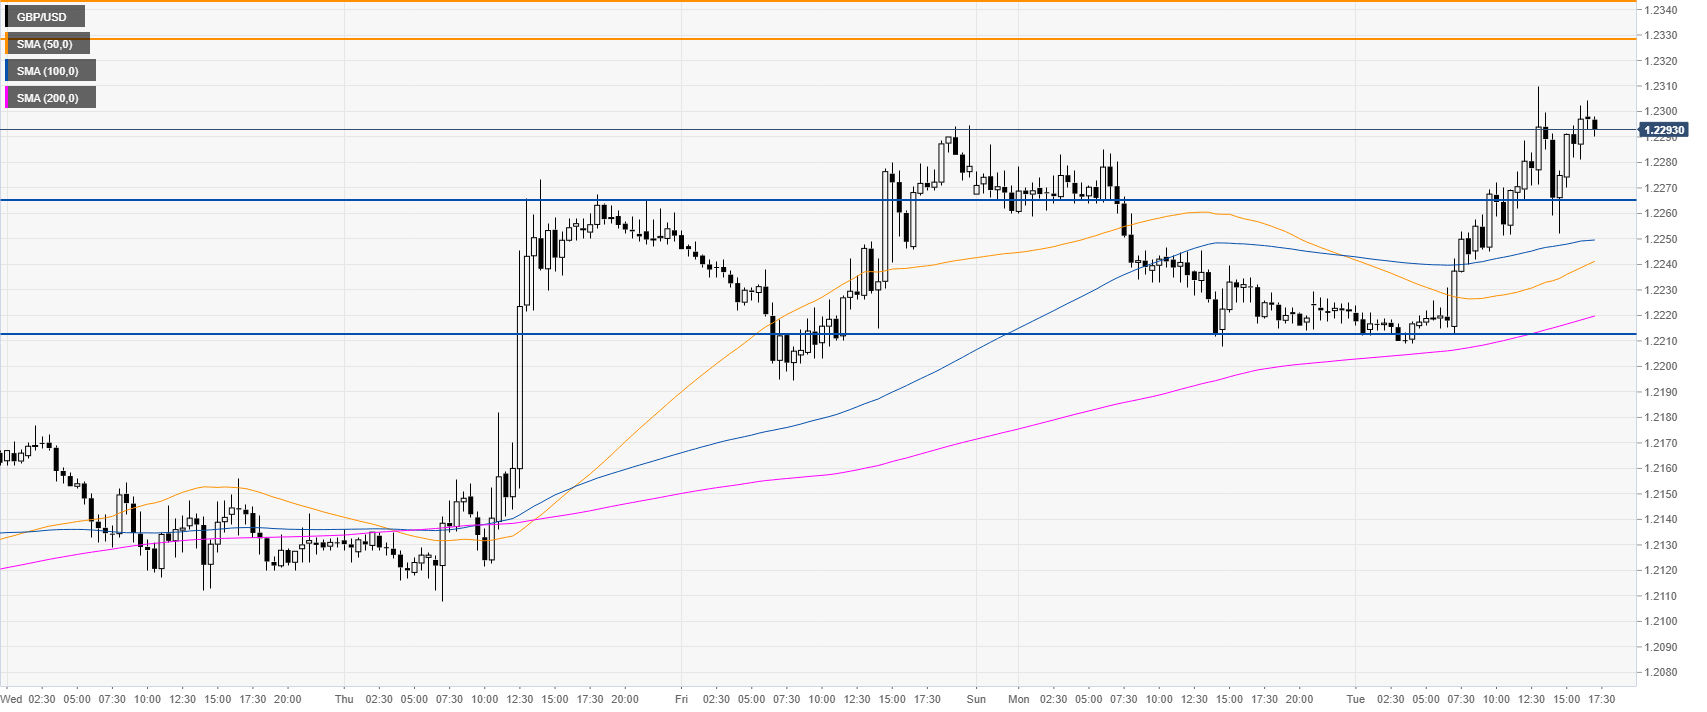
GBP/USD 30-minute chart
GBP/USD is trading above the main SMAs, suggesting a bullish bias in the short term. Immediate supports are seen at 1.2265 and 1.2214 levels.
Additional key levels
