- GBP/USD is trading in a tight range below the 1.2194 resistance.
- The levels to beat for bears are seen at 1.2156, followed by 1.2125 support levels.
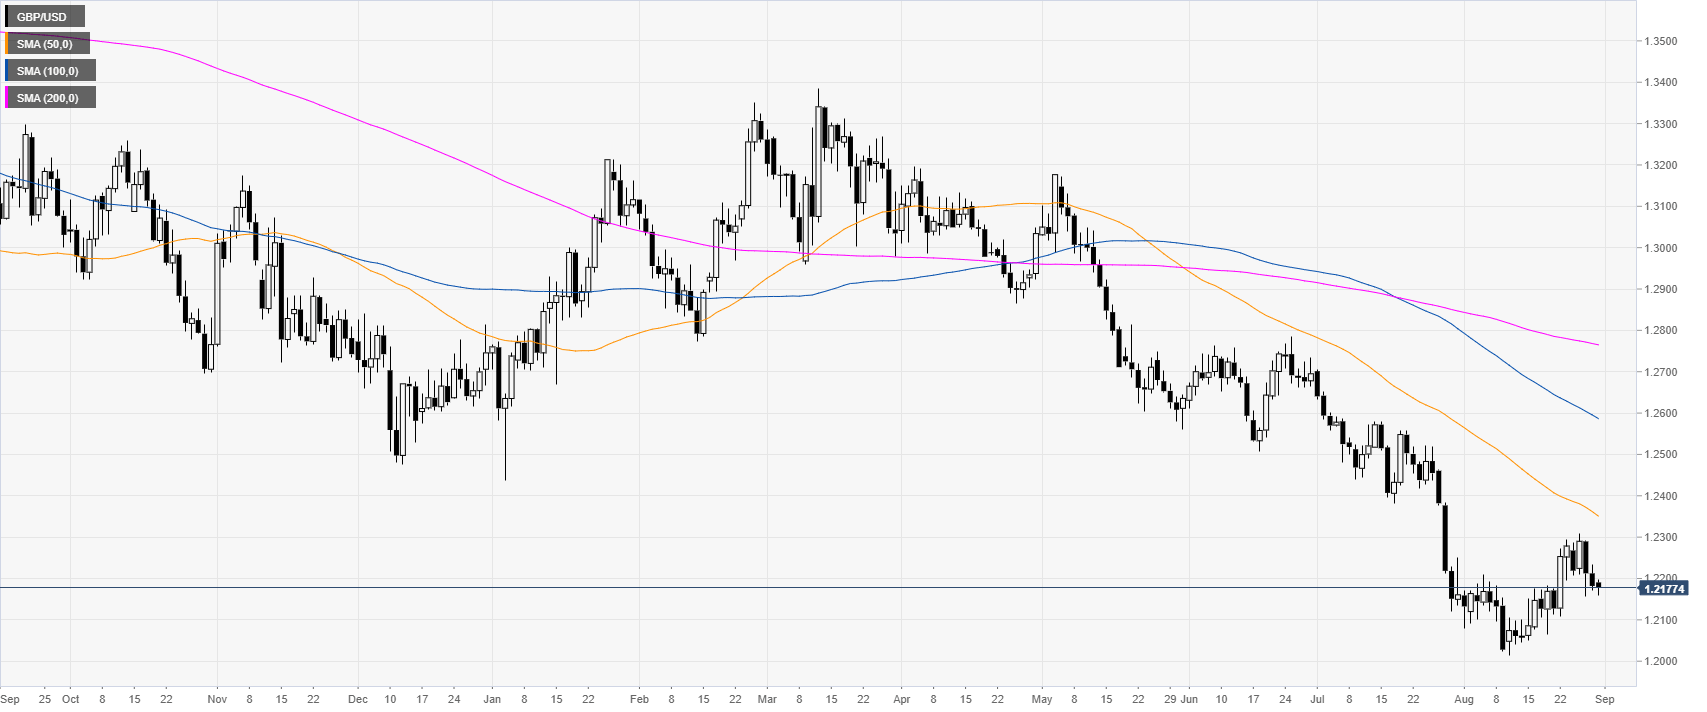
GBP/USD daily chart
The Great British Pound is trading in a bear trend below the main daily simple moving averages (SMAs). The market is down for the third day in a row.
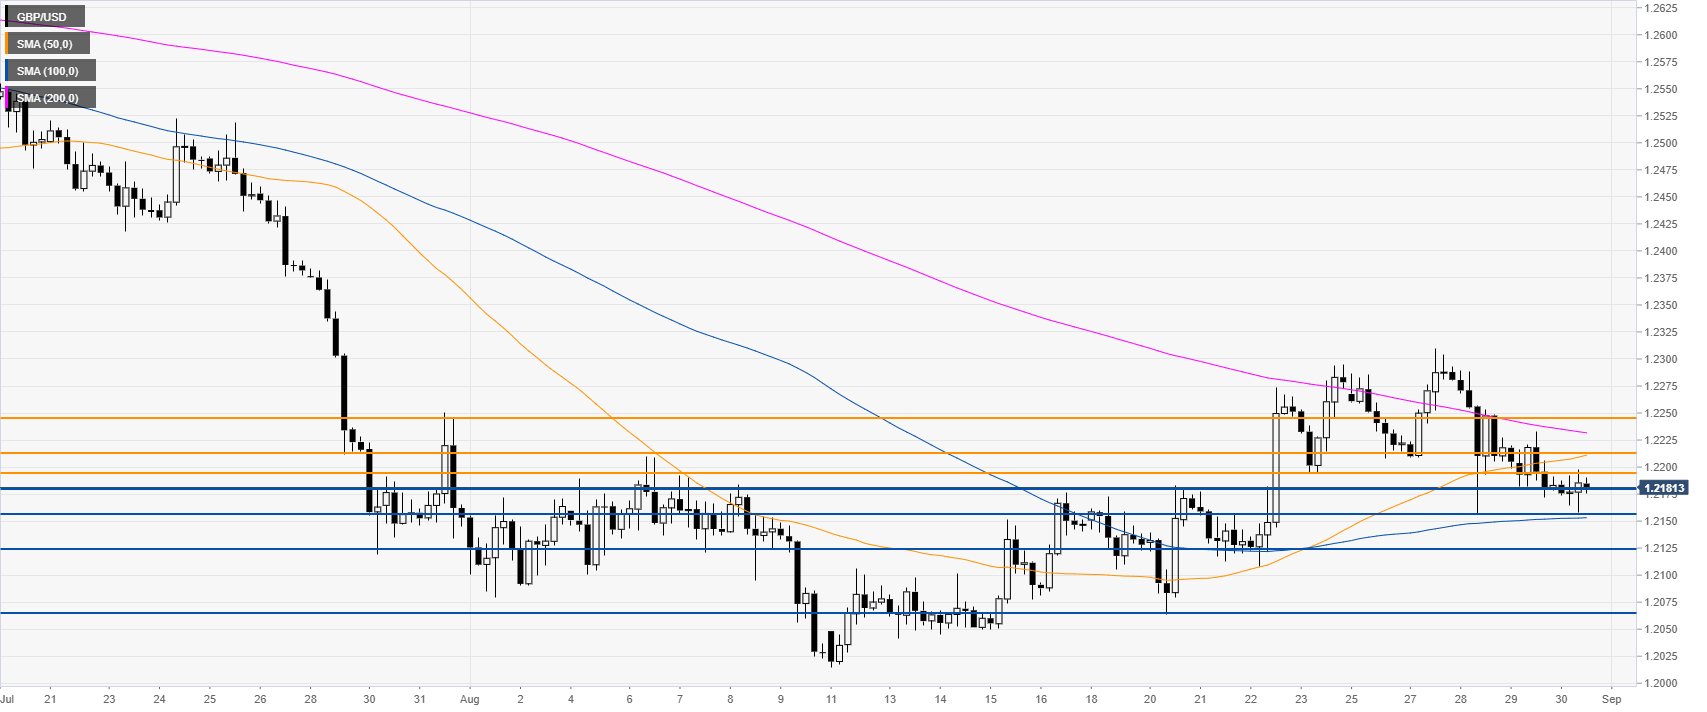
GBP/USD 4-hour chart
The Cable is trading below 1.2194 resistance and the 50/200 SMAs on the 4-hour time frame. Sellers are most likely looking for a breakdown below 1.2156 support as well as the 1.2125 to potentially reach 1.2065 levels, according to the Technical Confluences Indicator.
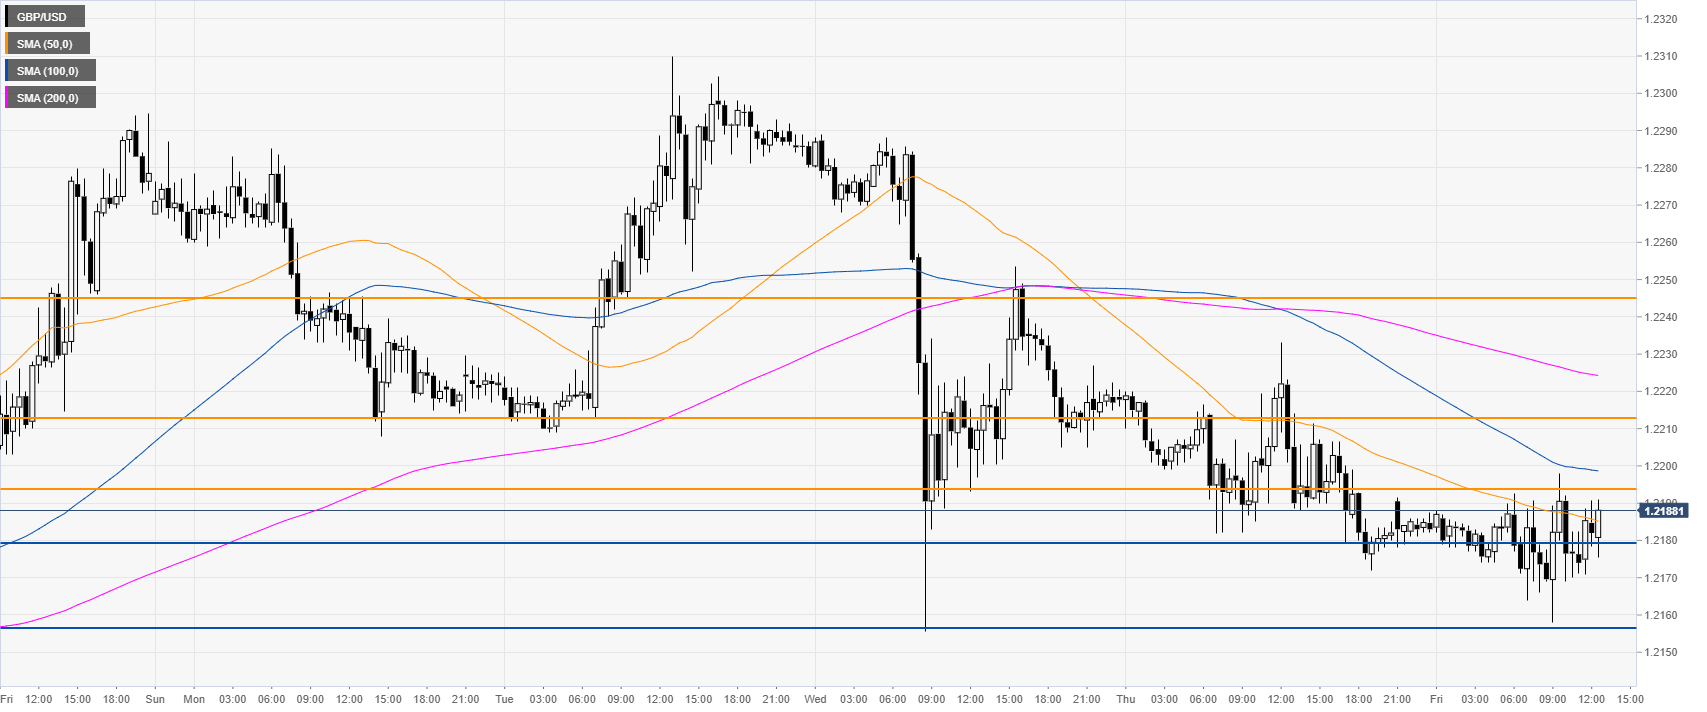
GBP/USD 30-minute chart
GBP/USD is trading below the 100/200 SMAs, suggesting a bearish bias in the near term. Immediate resistances are seen at the 1.2194, 1.2214 and 1.2245 levels, according to the Technical Confluences Indicator.
Additional key levels
