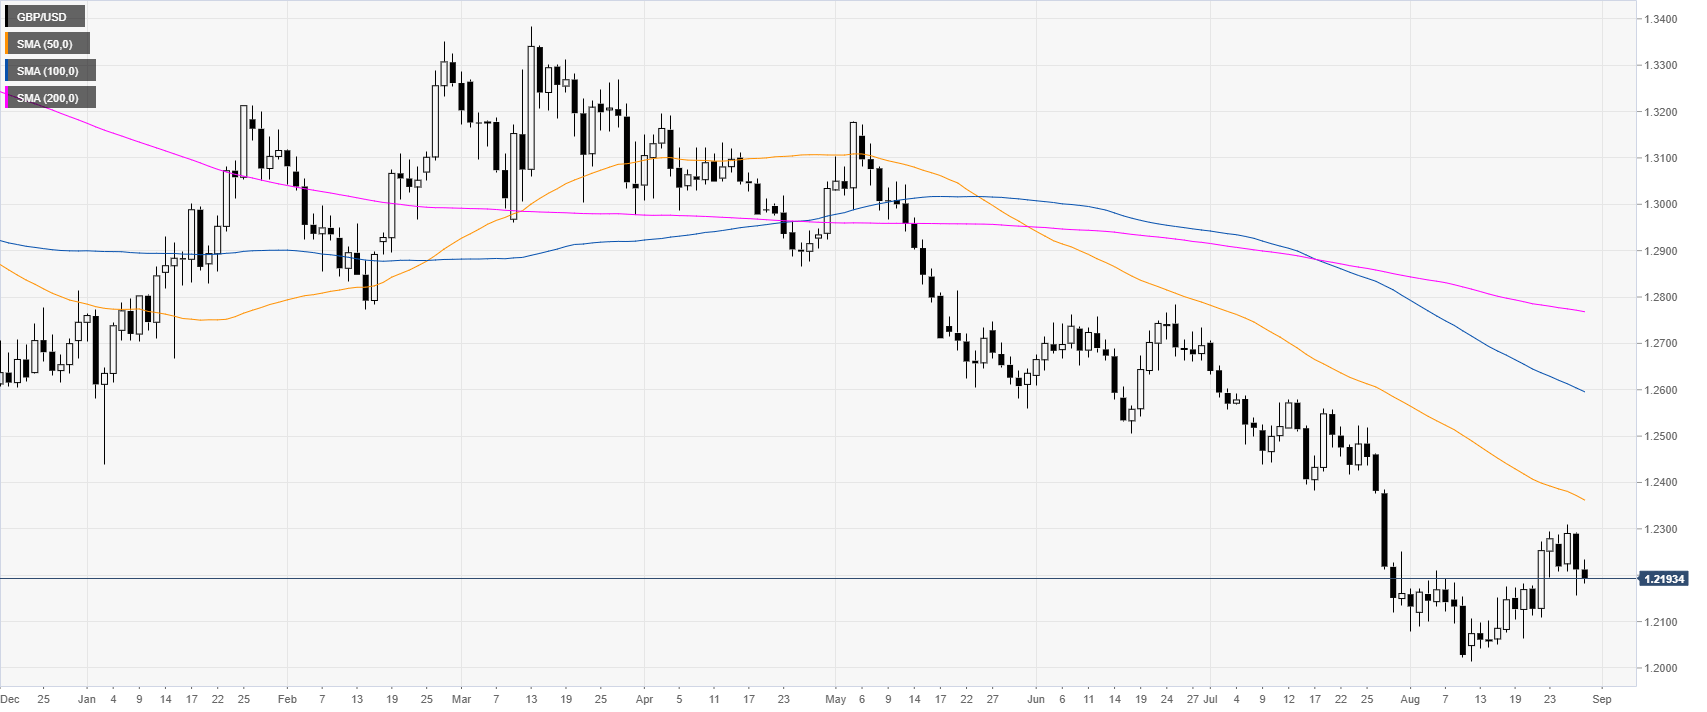
- GBP/USD is off the August highs after reaching the 1.2310 level on Tuesday.
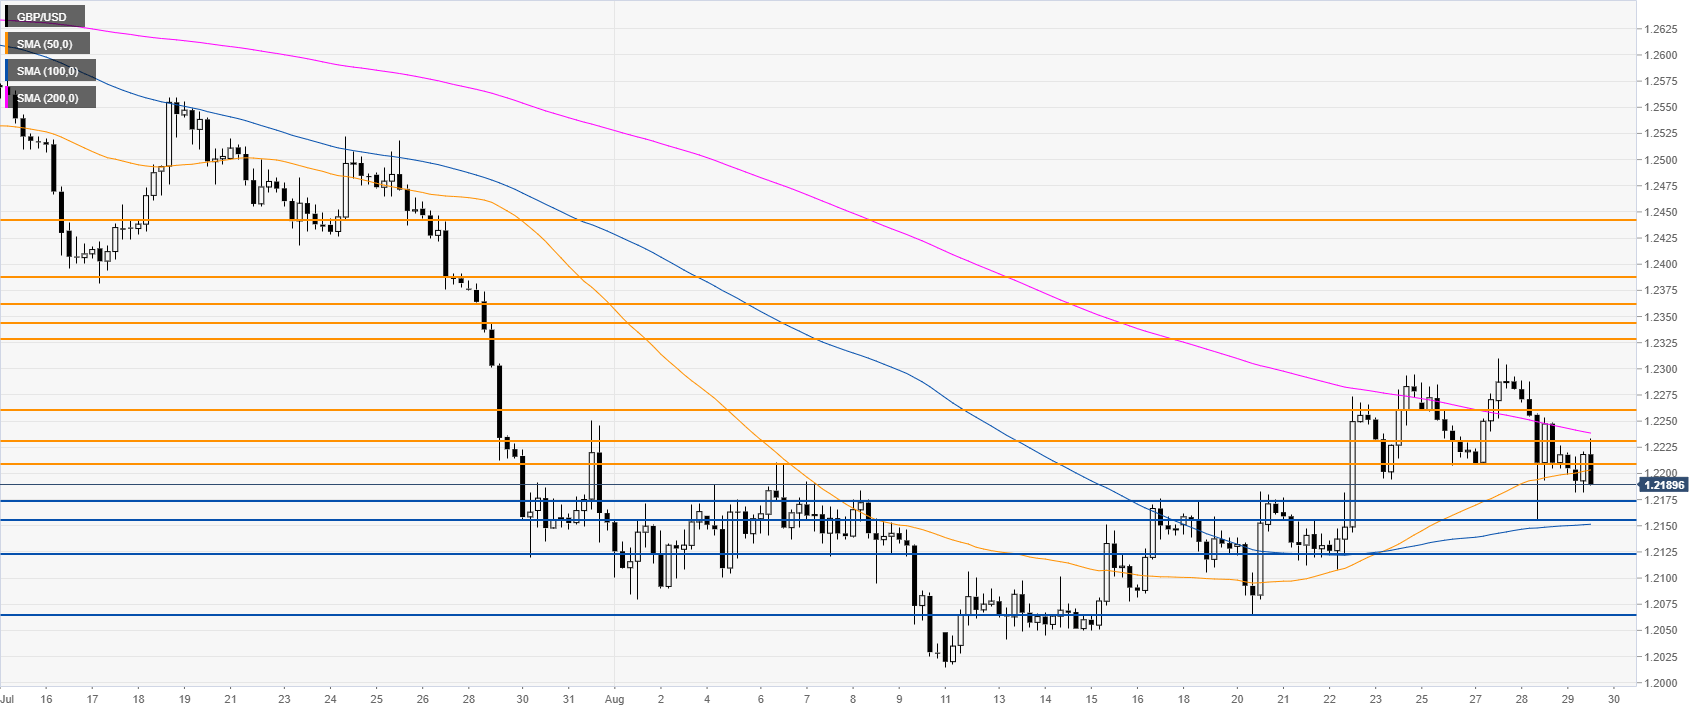
- The levels to beat for bears are seen at 1.2173, followed by 1.2122 support levels.
GBP/USD daily chart
The Great British Pound is in a bear trend below the main daily simple moving averages (SMAs). However, in the last two and a half weeks, the market has been reversing up after printing a 2019 low at the 1.2015 level.
GBP/USD 4-hour chart
The Cable is trading below 1.2211 resistance and the 50/200 SMAs on the 4-hour time frame. Bears are most likely looking for a breakdown below 1.2211 support and the 1.2173, 1.2122 and 1.2065 levels, according to the Technical Confluences Indicator.
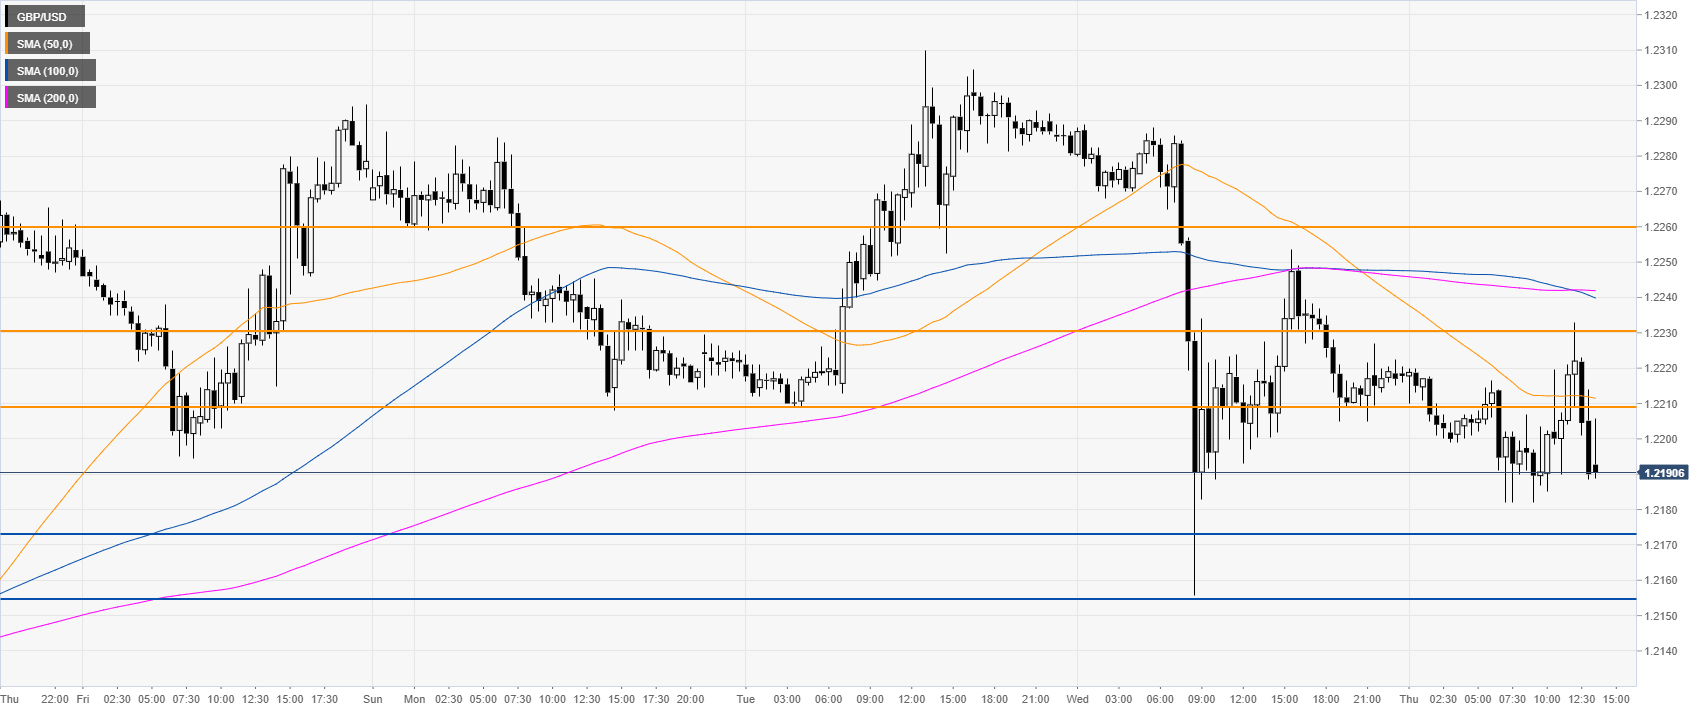
GBP/USD 30-minute chart
GBP/USD is trading below its main SMAs, suggesting a bearish bias in the near term. Immediate resistance is seen at the 1.2211 and 1.2230 levels, according to the Technical Confluences Indicator.
Additional key levels
